
Advertisement
- United Kingdom
- /
- Software
- /
- AIM:SKL
Skillcast Group plc's (LON:SKL) P/S Is Still On The Mark Following 26% Share Price Bounce
Skillcast Group plc (LON:SKL) shares have had a really impressive month, gaining 26% after a shaky period beforehand. Looking back a bit further, it's encouraging to see the stock is up 26% in the last year.
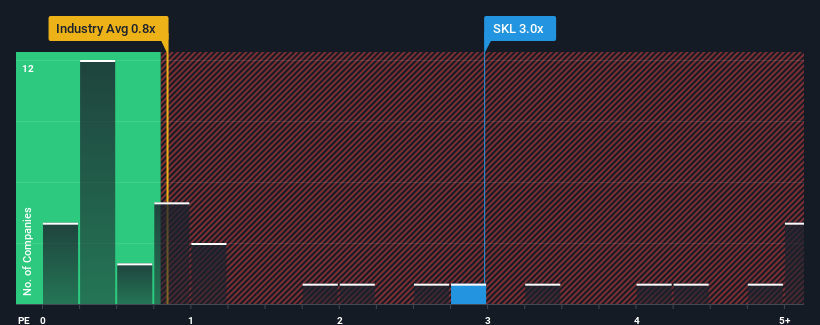
Following the firm bounce in price, when almost half of the companies in the United Kingdom's Consumer Services industry have price-to-sales ratios (or "P/S") below 2.2x, you may consider Skillcast Group as a stock probably not worth researching with its 3x P/S ratio. Although, it's not wise to just take the P/S at face value as there may be an explanation why it's as high as it is.
View our latest analysis for Skillcast Group
What Does Skillcast Group's Recent Performance Look Like?
Recent times have been pleasing for Skillcast Group as its revenue has risen in spite of the industry's average revenue going into reverse. It seems that many are expecting the company to continue defying the broader industry adversity, which has increased investors’ willingness to pay up for the stock. If not, then existing shareholders might be a little nervous about the viability of the share price.
Keen to find out how analysts think Skillcast Group's future stacks up against the industry? In that case, our free report is a great place to start.Do Revenue Forecasts Match The High P/S Ratio?
The only time you'd be truly comfortable seeing a P/S as high as Skillcast Group's is when the company's growth is on track to outshine the industry.
If we review the last year of revenue growth, the company posted a terrific increase of 17%. The strong recent performance means it was also able to grow revenue by 57% in total over the last three years. So we can start by confirming that the company has done a great job of growing revenue over that time.
Turning to the outlook, the next year should generate growth of 16% as estimated by the lone analyst watching the company. With the industry only predicted to deliver 3.7%, the company is positioned for a stronger revenue result.
With this in mind, it's not hard to understand why Skillcast Group's P/S is high relative to its industry peers. It seems most investors are expecting this strong future growth and are willing to pay more for the stock.
What We Can Learn From Skillcast Group's P/S?
The large bounce in Skillcast Group's shares has lifted the company's P/S handsomely. Using the price-to-sales ratio alone to determine if you should sell your stock isn't sensible, however it can be a practical guide to the company's future prospects.
We've established that Skillcast Group maintains its high P/S on the strength of its forecasted revenue growth being higher than the the rest of the Consumer Services industry, as expected. Right now shareholders are comfortable with the P/S as they are quite confident future revenues aren't under threat. It's hard to see the share price falling strongly in the near future under these circumstances.
Before you take the next step, you should know about the 2 warning signs for Skillcast Group (1 doesn't sit too well with us!) that we have uncovered.
If these risks are making you reconsider your opinion on Skillcast Group, explore our interactive list of high quality stocks to get an idea of what else is out there.
New: Manage All Your Stock Portfolios in One Place
We've created the ultimate portfolio companion for stock investors, and it's free.
• Connect an unlimited number of Portfolios and see your total in one currency
• Be alerted to new Warning Signs or Risks via email or mobile
• Track the Fair Value of your stocks
Have feedback on this article? Concerned about the content? Get in touch with us directly. Alternatively, email editorial-team (at) simplywallst.com.
This article by Simply Wall St is general in nature. We provide commentary based on historical data and analyst forecasts only using an unbiased methodology and our articles are not intended to be financial advice. It does not constitute a recommendation to buy or sell any stock, and does not take account of your objectives, or your financial situation. We aim to bring you long-term focused analysis driven by fundamental data. Note that our analysis may not factor in the latest price-sensitive company announcements or qualitative material. Simply Wall St has no position in any stocks mentioned.
About AIM:SKL
Skillcast Group
Provides staff compliance training services in the United Kingdom, Malta, rest of Europe, and internationally.
Flawless balance sheet with reasonable growth potential.
Market Insights

Advertisement
Community Narratives
MicroVision will explode future revenue by 380.37% with a vision towards success
Fair Value US$60.00|98.4% undervalued
TH
Community Contributor
The Indispensable Artery for a New North American Economy
Fair Value CA$132.87|1.3% undervalued
TI
Community Contributor