Stock Analysis
- United Kingdom
- /
- Food and Staples Retail
- /
- LSE:SBRY
Those who invested in J Sainsbury (LON:SBRY) a year ago are up 23%

These days it's easy to simply buy an index fund, and your returns should (roughly) match the market. But if you pick the right individual stocks, you could make more than that. To wit, the J Sainsbury plc (LON:SBRY) share price is 17% higher than it was a year ago, much better than the market decline of around 6.8% (not including dividends) in the same period. So that should have shareholders smiling. The longer term returns are positive, with the share price up 15% in three years.
Now it's worth having a look at the company's fundamentals too, because that will help us determine if the long term shareholder return has matched the performance of the underlying business.
Check out our latest analysis for J Sainsbury
To quote Buffett, 'Ships will sail around the world but the Flat Earth Society will flourish. There will continue to be wide discrepancies between price and value in the marketplace...' By comparing earnings per share (EPS) and share price changes over time, we can get a feel for how investor attitudes to a company have morphed over time.
Over the last twelve months, J Sainsbury actually shrank its EPS by 87%.
So we don't think that investors are paying too much attention to EPS. Indeed, when EPS is declining but the share price is up, it often means the market is considering other factors.
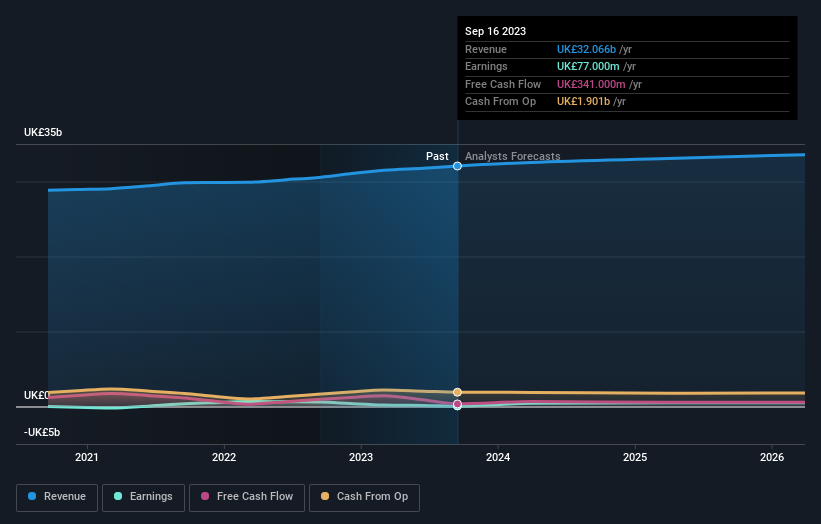
Absent any improvement, we don't think a thirst for dividends is pushing up the J Sainsbury's share price. Rather, we'd posit that the revenue increase of 4.9% might be more meaningful. After all, it's not necessarily a bad thing if a business sacrifices profits today in pursuit of profit tomorrow (metaphorically speaking).
You can see below how earnings and revenue have changed over time (discover the exact values by clicking on the image).
J Sainsbury is a well known stock, with plenty of analyst coverage, suggesting some visibility into future growth. So it makes a lot of sense to check out what analysts think J Sainsbury will earn in the future (free analyst consensus estimates)
What About Dividends?
When looking at investment returns, it is important to consider the difference between total shareholder return (TSR) and share price return. The TSR incorporates the value of any spin-offs or discounted capital raisings, along with any dividends, based on the assumption that the dividends are reinvested. Arguably, the TSR gives a more comprehensive picture of the return generated by a stock. In the case of J Sainsbury, it has a TSR of 23% for the last 1 year. That exceeds its share price return that we previously mentioned. This is largely a result of its dividend payments!
A Different Perspective
We're pleased to report that J Sainsbury shareholders have received a total shareholder return of 23% over one year. Of course, that includes the dividend. That's better than the annualised return of 6% over half a decade, implying that the company is doing better recently. In the best case scenario, this may hint at some real business momentum, implying that now could be a great time to delve deeper. While it is well worth considering the different impacts that market conditions can have on the share price, there are other factors that are even more important. For example, we've discovered 3 warning signs for J Sainsbury (1 is potentially serious!) that you should be aware of before investing here.
Of course, you might find a fantastic investment by looking elsewhere. So take a peek at this free list of companies we expect will grow earnings.
Please note, the market returns quoted in this article reflect the market weighted average returns of stocks that currently trade on British exchanges.
Valuation is complex, but we're helping make it simple.
Find out whether J Sainsbury is potentially over or undervalued by checking out our comprehensive analysis, which includes fair value estimates, risks and warnings, dividends, insider transactions and financial health.
View the Free AnalysisHave feedback on this article? Concerned about the content? Get in touch with us directly. Alternatively, email editorial-team (at) simplywallst.com.
This article by Simply Wall St is general in nature. We provide commentary based on historical data and analyst forecasts only using an unbiased methodology and our articles are not intended to be financial advice. It does not constitute a recommendation to buy or sell any stock, and does not take account of your objectives, or your financial situation. We aim to bring you long-term focused analysis driven by fundamental data. Note that our analysis may not factor in the latest price-sensitive company announcements or qualitative material. Simply Wall St has no position in any stocks mentioned.
About LSE:SBRY
J Sainsbury
J Sainsbury plc, together with its subsidiaries, engages in the food, general merchandise and clothing retailing, and financial services activities in the United Kingdom and the Republic of Ireland.
Excellent balance sheet with moderate growth potential.

