
Advertisement
- United Kingdom
- /
- Food and Staples Retail
- /
- LSE:SBRY
The Return Trends At J Sainsbury (LON:SBRY) Look Promising
If we want to find a stock that could multiply over the long term, what are the underlying trends we should look for? Typically, we'll want to notice a trend of growing return on capital employed (ROCE) and alongside that, an expanding base of capital employed. This shows us that it's a compounding machine, able to continually reinvest its earnings back into the business and generate higher returns. Speaking of which, we noticed some great changes in J Sainsbury's (LON:SBRY) returns on capital, so let's have a look.
What Is Return On Capital Employed (ROCE)?
For those that aren't sure what ROCE is, it measures the amount of pre-tax profits a company can generate from the capital employed in its business. Analysts use this formula to calculate it for J Sainsbury:
Return on Capital Employed = Earnings Before Interest and Tax (EBIT) ÷ (Total Assets - Current Liabilities)
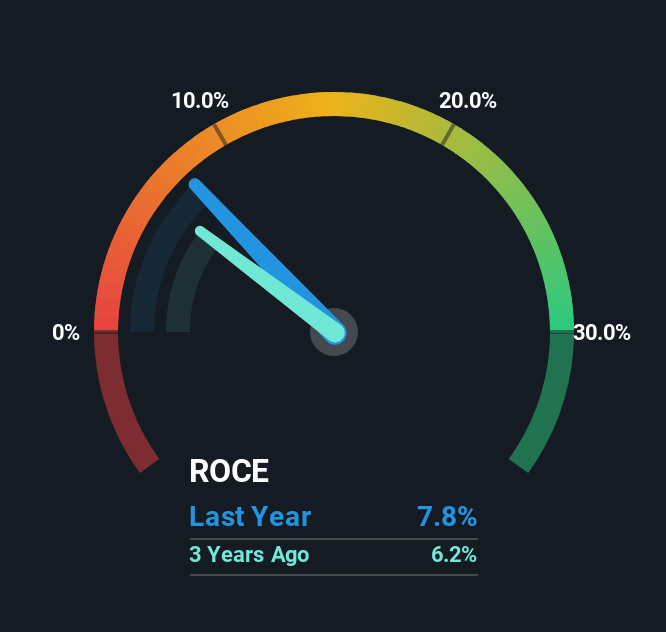
0.078 = UK£1.0b ÷ (UK£25b - UK£11b) (Based on the trailing twelve months to March 2025).
Therefore, J Sainsbury has an ROCE of 7.8%. In absolute terms, that's a low return and it also under-performs the Consumer Retailing industry average of 12%.
Check out our latest analysis for J Sainsbury
Above you can see how the current ROCE for J Sainsbury compares to its prior returns on capital, but there's only so much you can tell from the past. If you're interested, you can view the analysts predictions in our free analyst report for J Sainsbury .
The Trend Of ROCE
J Sainsbury's ROCE growth is quite impressive. More specifically, while the company has kept capital employed relatively flat over the last five years, the ROCE has climbed 22% in that same time. So our take on this is that the business has increased efficiencies to generate these higher returns, all the while not needing to make any additional investments. The company is doing well in that sense, and it's worth investigating what the management team has planned for long term growth prospects.
On a separate but related note, it's important to know that J Sainsbury has a current liabilities to total assets ratio of 46%, which we'd consider pretty high. This effectively means that suppliers (or short-term creditors) are funding a large portion of the business, so just be aware that this can introduce some elements of risk. Ideally we'd like to see this reduce as that would mean fewer obligations bearing risks.
The Bottom Line
As discussed above, J Sainsbury appears to be getting more proficient at generating returns since capital employed has remained flat but earnings (before interest and tax) are up. And a remarkable 123% total return over the last five years tells us that investors are expecting more good things to come in the future. So given the stock has proven it has promising trends, it's worth researching the company further to see if these trends are likely to persist.
J Sainsbury does have some risks though, and we've spotted 2 warning signs for J Sainsbury that you might be interested in.
For those who like to invest in solid companies, check out this free list of companies with solid balance sheets and high returns on equity.
New: Manage All Your Stock Portfolios in One Place
We've created the ultimate portfolio companion for stock investors, and it's free.
• Connect an unlimited number of Portfolios and see your total in one currency
• Be alerted to new Warning Signs or Risks via email or mobile
• Track the Fair Value of your stocks
Have feedback on this article? Concerned about the content? Get in touch with us directly. Alternatively, email editorial-team (at) simplywallst.com.
This article by Simply Wall St is general in nature. We provide commentary based on historical data and analyst forecasts only using an unbiased methodology and our articles are not intended to be financial advice. It does not constitute a recommendation to buy or sell any stock, and does not take account of your objectives, or your financial situation. We aim to bring you long-term focused analysis driven by fundamental data. Note that our analysis may not factor in the latest price-sensitive company announcements or qualitative material. Simply Wall St has no position in any stocks mentioned.
About LSE:SBRY
J Sainsbury
Engages in the food, general merchandise and clothing retailing, and financial services activities in the United Kingdom.
Solid track record and good value.
Similar Companies
Market Insights

Advertisement
Community Narratives
MicroVision will explode future revenue by 380.37% with a vision towards success
Fair Value US$60|98.4% undervalued
TH
Community Contributor
The Indispensable Artery for a New North American Economy
Fair Value CA$132.87|0.8% undervalued
TI
Community Contributor
Recently Updated Narratives
CO

composite32 on TAV Havalimanlari Holding ·
TAV Havalimanlari Holding will fly high with 25.68% revenue growth
Fair Value:₺545.1648.6% undervalued
2 followersusers have followed this narrative
0 commentsusers have commented on this narrative
0 likesusers have liked this narrative
RO


Robbo on Fiducian Group ·
Fiducian: Compliance Clouds or Value Opportunity?
Fair Value:AU$122.3% overvalued
1 followerusers have followed this narrative
0 commentsusers have commented on this narrative
0 likesusers have liked this narrative
MA


MarkoVT on COVER ·
Q3 Outlook modestly optimistic
Fair Value:JP¥1.65k2.0% overvalued
1 followerusers have followed this narrative
0 commentsusers have commented on this narrative
0 likesusers have liked this narrative
Popular Narratives
TH

TheWallstreetKing on MicroVision ·
MicroVision will explode future revenue by 380.37% with a vision towards success
Fair Value:US$6098.4% undervalued
92 followersusers have followed this narrative
10 commentsusers have commented on this narrative
18 likesusers have liked this narrative
OS


oscargarcia on Alphabet ·
The company that turned a verb into a global necessity and basically runs the modern internet, digital ads, smartphones, maps, and AI.
Fair Value:US$3405.9% undervalued
136 followersusers have followed this narrative
6 commentsusers have commented on this narrative
18 likesusers have liked this narrative
AN


AnalystConsensusTarget on NVIDIA ·
NVDA: Expanding AI Demand Will Drive Major Data Center Investments Through 2026
Fair Value:US$232.7922.6% undervalued
927 followersusers have followed this narrative
6 commentsusers have commented on this narrative
22 likesusers have liked this narrative