- United Kingdom
- /
- Consumer Durables
- /
- LSE:VID
With A 32% Price Drop For Videndum Plc (LON:VID) You'll Still Get What You Pay For

Unfortunately for some shareholders, the Videndum Plc (LON:VID) share price has dived 32% in the last thirty days, prolonging recent pain. Instead of being rewarded, shareholders who have already held through the last twelve months are now sitting on a 49% share price drop.
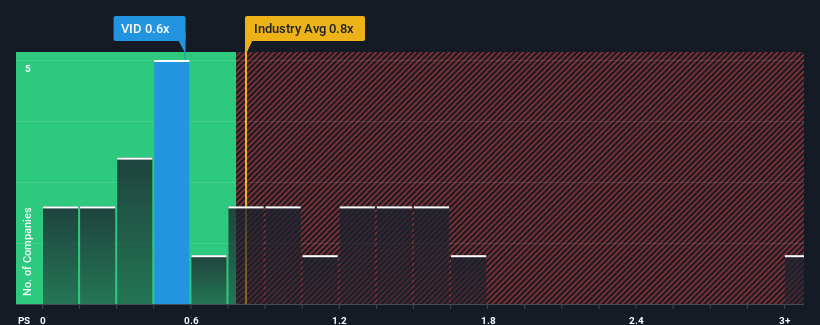
Although its price has dipped substantially, there still wouldn't be many who think Videndum's price-to-sales (or "P/S") ratio of 0.6x is worth a mention when the median P/S in the United Kingdom's Consumer Durables industry is similar at about 0.7x. While this might not raise any eyebrows, if the P/S ratio is not justified investors could be missing out on a potential opportunity or ignoring looming disappointment.
Check out our latest analysis for Videndum

How Videndum Has Been Performing
With revenue that's retreating more than the industry's average of late, Videndum has been very sluggish. Perhaps the market is expecting future revenue performance to begin matching the rest of the industry, which has kept the P/S from declining. You'd much rather the company improve its revenue if you still believe in the business. If not, then existing shareholders may be a little nervous about the viability of the share price.
If you'd like to see what analysts are forecasting going forward, you should check out our free report on Videndum.Do Revenue Forecasts Match The P/S Ratio?
In order to justify its P/S ratio, Videndum would need to produce growth that's similar to the industry.
Taking a look back first, the company's revenue growth last year wasn't something to get excited about as it posted a disappointing decline of 24%. This means it has also seen a slide in revenue over the longer-term as revenue is down 16% in total over the last three years. Therefore, it's fair to say the revenue growth recently has been undesirable for the company.
Shifting to the future, estimates from the three analysts covering the company suggest revenue should grow by 13% over the next year. Meanwhile, the rest of the industry is forecast to expand by 12%, which is not materially different.
With this information, we can see why Videndum is trading at a fairly similar P/S to the industry. It seems most investors are expecting to see average future growth and are only willing to pay a moderate amount for the stock.
What Does Videndum's P/S Mean For Investors?
With its share price dropping off a cliff, the P/S for Videndum looks to be in line with the rest of the Consumer Durables industry. While the price-to-sales ratio shouldn't be the defining factor in whether you buy a stock or not, it's quite a capable barometer of revenue expectations.
A Videndum's P/S seems about right to us given the knowledge that analysts are forecasting a revenue outlook that is similar to the Consumer Durables industry. At this stage investors feel the potential for an improvement or deterioration in revenue isn't great enough to push P/S in a higher or lower direction. Unless these conditions change, they will continue to support the share price at these levels.
There are also other vital risk factors to consider before investing and we've discovered 1 warning sign for Videndum that you should be aware of.
If companies with solid past earnings growth is up your alley, you may wish to see this free collection of other companies with strong earnings growth and low P/E ratios.
New: Manage All Your Stock Portfolios in One Place
We've created the ultimate portfolio companion for stock investors, and it's free.
• Connect an unlimited number of Portfolios and see your total in one currency
• Be alerted to new Warning Signs or Risks via email or mobile
• Track the Fair Value of your stocks
Have feedback on this article? Concerned about the content? Get in touch with us directly. Alternatively, email editorial-team (at) simplywallst.com.
This article by Simply Wall St is general in nature. We provide commentary based on historical data and analyst forecasts only using an unbiased methodology and our articles are not intended to be financial advice. It does not constitute a recommendation to buy or sell any stock, and does not take account of your objectives, or your financial situation. We aim to bring you long-term focused analysis driven by fundamental data. Note that our analysis may not factor in the latest price-sensitive company announcements or qualitative material. Simply Wall St has no position in any stocks mentioned.
About LSE:VID
Videndum
Designs, manufactures, and distributes products and services that enable end users to capture and share content for the broadcast, cinematic, video, photographic, audio, and smartphone applications.
Undervalued with moderate growth potential.
Market Insights
Community Narratives


