
Advertisement
- United Kingdom
- /
- Consumer Durables
- /
- LSE:VID
Positive Sentiment Still Eludes Videndum Plc (LON:VID) Following 34% Share Price Slump

Videndum Plc (LON:VID) shareholders won't be pleased to see that the share price has had a very rough month, dropping 34% and undoing the prior period's positive performance. Instead of being rewarded, shareholders who have already held through the last twelve months are now sitting on a 25% share price drop.
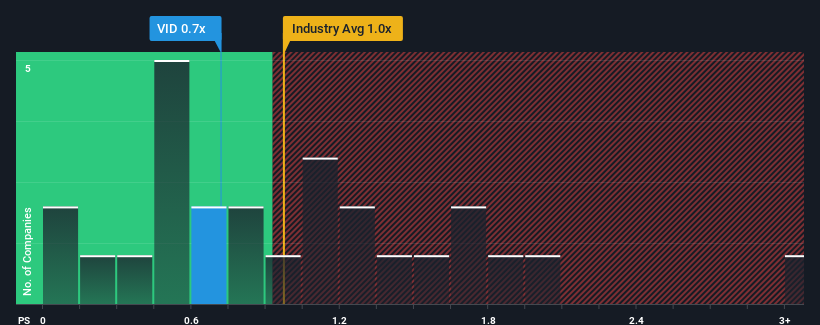
Although its price has dipped substantially, there still wouldn't be many who think Videndum's price-to-sales (or "P/S") ratio of 0.7x is worth a mention when the median P/S in the United Kingdom's Consumer Durables industry is similar at about 1x. However, investors might be overlooking a clear opportunity or potential setback if there is no rational basis for the P/S.
View our latest analysis for Videndum
How Has Videndum Performed Recently?
Videndum has been struggling lately as its revenue has declined faster than most other companies. One possibility is that the P/S is moderate because investors think the company's revenue trend will eventually fall in line with most others in the industry. If you still like the company, you'd want its revenue trajectory to turn around before making any decisions. Or at the very least, you'd be hoping it doesn't keep underperforming if your plan is to pick up some stock while it's not in favour.
If you'd like to see what analysts are forecasting going forward, you should check out our free report on Videndum.How Is Videndum's Revenue Growth Trending?
There's an inherent assumption that a company should be matching the industry for P/S ratios like Videndum's to be considered reasonable.
Retrospectively, the last year delivered a frustrating 26% decrease to the company's top line. As a result, revenue from three years ago have also fallen 16% overall. So unfortunately, we have to acknowledge that the company has not done a great job of growing revenue over that time.
Shifting to the future, estimates from the four analysts covering the company suggest revenue should grow by 15% over the next year. Meanwhile, the rest of the industry is forecast to only expand by 9.6%, which is noticeably less attractive.
With this information, we find it interesting that Videndum is trading at a fairly similar P/S compared to the industry. Apparently some shareholders are skeptical of the forecasts and have been accepting lower selling prices.
What We Can Learn From Videndum's P/S?
With its share price dropping off a cliff, the P/S for Videndum looks to be in line with the rest of the Consumer Durables industry. Generally, our preference is to limit the use of the price-to-sales ratio to establishing what the market thinks about the overall health of a company.
Despite enticing revenue growth figures that outpace the industry, Videndum's P/S isn't quite what we'd expect. There could be some risks that the market is pricing in, which is preventing the P/S ratio from matching the positive outlook. It appears some are indeed anticipating revenue instability, because these conditions should normally provide a boost to the share price.
And what about other risks? Every company has them, and we've spotted 2 warning signs for Videndum (of which 1 makes us a bit uncomfortable!) you should know about.
If strong companies turning a profit tickle your fancy, then you'll want to check out this free list of interesting companies that trade on a low P/E (but have proven they can grow earnings).
New: Manage All Your Stock Portfolios in One Place
We've created the ultimate portfolio companion for stock investors, and it's free.
• Connect an unlimited number of Portfolios and see your total in one currency
• Be alerted to new Warning Signs or Risks via email or mobile
• Track the Fair Value of your stocks
Have feedback on this article? Concerned about the content? Get in touch with us directly. Alternatively, email editorial-team (at) simplywallst.com.
This article by Simply Wall St is general in nature. We provide commentary based on historical data and analyst forecasts only using an unbiased methodology and our articles are not intended to be financial advice. It does not constitute a recommendation to buy or sell any stock, and does not take account of your objectives, or your financial situation. We aim to bring you long-term focused analysis driven by fundamental data. Note that our analysis may not factor in the latest price-sensitive company announcements or qualitative material. Simply Wall St has no position in any stocks mentioned.
About LSE:VID
Videndum
Designs, manufactures, and distributes products and services that enable end users to capture and share content for the broadcast, cinematic, video, photographic, audio, and smartphone applications.
Undervalued with moderate growth potential.
Market Insights

Advertisement
Community Narratives
Groundbreaking therapies that could change the treatment landscape for PTSD, fibromyalgia, MS & Alzheimer’s
Fair Value US$6.20|86.9% undervalued
CM
Community Contributor
DigitalOcean Will Grow 14% by Embracing AI with Paperspace Acquisition
Fair Value US$50.00|42.8% undervalued
NE
Community Contributor
Viant Technology: A Rising AdTech Challenger in the AI-Powered CTV Market
Fair Value US$38.61|66.0% undervalued
BL
Community Contributor
Volvo will Accelerate Forward into Electric and Autonomous Leadership in Five Years
Fair Value SEK 438.80|40.8% undervalued
UN
Community Contributor