- United Kingdom
- /
- Consumer Durables
- /
- LSE:VID
Investors Still Aren't Entirely Convinced By Videndum Plc's (LON:VID) Revenues Despite 26% Price Jump

The Videndum Plc (LON:VID) share price has done very well over the last month, posting an excellent gain of 26%. Not all shareholders will be feeling jubilant, since the share price is still down a very disappointing 37% in the last twelve months.
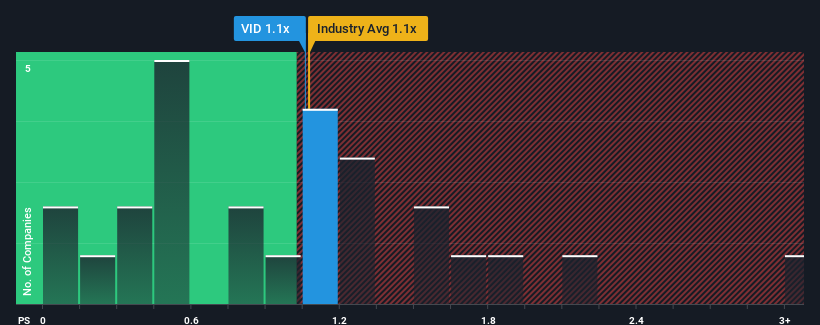
Although its price has surged higher, you could still be forgiven for feeling indifferent about Videndum's P/S ratio of 1.1x, since the median price-to-sales (or "P/S") ratio for the Consumer Durables industry in the United Kingdom is about the same. Although, it's not wise to simply ignore the P/S without explanation as investors may be disregarding a distinct opportunity or a costly mistake.
Check out our latest analysis for Videndum

How Has Videndum Performed Recently?
Recent times haven't been great for Videndum as its revenue has been falling quicker than most other companies. Perhaps the market is expecting future revenue performance to begin matching the rest of the industry, which has kept the P/S from declining. So while you could say the stock is cheap, investors will be looking for improvement before they see it as good value. Or at the very least, you'd be hoping it doesn't keep underperforming if your plan is to pick up some stock while it's not in favour.
If you'd like to see what analysts are forecasting going forward, you should check out our free report on Videndum.Is There Some Revenue Growth Forecasted For Videndum?
Videndum's P/S ratio would be typical for a company that's only expected to deliver moderate growth, and importantly, perform in line with the industry.
Retrospectively, the last year delivered a frustrating 31% decrease to the company's top line. Regardless, revenue has managed to lift by a handy 5.6% in aggregate from three years ago, thanks to the earlier period of growth. Although it's been a bumpy ride, it's still fair to say the revenue growth recently has been mostly respectable for the company.
Turning to the outlook, the next three years should generate growth of 11% per year as estimated by the four analysts watching the company. That's shaping up to be materially higher than the 6.1% per year growth forecast for the broader industry.
With this in consideration, we find it intriguing that Videndum's P/S is closely matching its industry peers. Apparently some shareholders are skeptical of the forecasts and have been accepting lower selling prices.
What We Can Learn From Videndum's P/S?
Videndum appears to be back in favour with a solid price jump bringing its P/S back in line with other companies in the industry We'd say the price-to-sales ratio's power isn't primarily as a valuation instrument but rather to gauge current investor sentiment and future expectations.
We've established that Videndum currently trades on a lower than expected P/S since its forecasted revenue growth is higher than the wider industry. Perhaps uncertainty in the revenue forecasts are what's keeping the P/S ratio consistent with the rest of the industry. At least the risk of a price drop looks to be subdued, but investors seem to think future revenue could see some volatility.
Before you take the next step, you should know about the 1 warning sign for Videndum that we have uncovered.
If companies with solid past earnings growth is up your alley, you may wish to see this free collection of other companies with strong earnings growth and low P/E ratios.
New: Manage All Your Stock Portfolios in One Place
We've created the ultimate portfolio companion for stock investors, and it's free.
• Connect an unlimited number of Portfolios and see your total in one currency
• Be alerted to new Warning Signs or Risks via email or mobile
• Track the Fair Value of your stocks
Have feedback on this article? Concerned about the content? Get in touch with us directly. Alternatively, email editorial-team (at) simplywallst.com.
This article by Simply Wall St is general in nature. We provide commentary based on historical data and analyst forecasts only using an unbiased methodology and our articles are not intended to be financial advice. It does not constitute a recommendation to buy or sell any stock, and does not take account of your objectives, or your financial situation. We aim to bring you long-term focused analysis driven by fundamental data. Note that our analysis may not factor in the latest price-sensitive company announcements or qualitative material. Simply Wall St has no position in any stocks mentioned.
About LSE:VID
Videndum
Designs, manufactures, and distributes products and services that enable end users to capture and share content for the broadcast, cinematic, video, photographic, audio, and smartphone applications.
Undervalued with moderate growth potential.
Market Insights
Community Narratives


