
Advertisement
- United Kingdom
- /
- Luxury
- /
- LSE:DOCS
Declining Stock and Solid Fundamentals: Is The Market Wrong About Dr. Martens plc (LON:DOCS)?

Dr. Martens (LON:DOCS) has had a rough three months with its share price down 25%. However, a closer look at its sound financials might cause you to think again. Given that fundamentals usually drive long-term market outcomes, the company is worth looking at. In this article, we decided to focus on Dr. Martens' ROE.
Return on equity or ROE is a key measure used to assess how efficiently a company's management is utilizing the company's capital. Simply put, it is used to assess the profitability of a company in relation to its equity capital.
Check out our latest analysis for Dr. Martens
How Is ROE Calculated?
Return on equity can be calculated by using the formula:
Return on Equity = Net Profit (from continuing operations) ÷ Shareholders' Equity
So, based on the above formula, the ROE for Dr. Martens is:
19% = UK£69m ÷ UK£368m (Based on the trailing twelve months to March 2024).
The 'return' is the profit over the last twelve months. Another way to think of that is that for every £1 worth of equity, the company was able to earn £0.19 in profit.
Why Is ROE Important For Earnings Growth?
Thus far, we have learned that ROE measures how efficiently a company is generating its profits. Depending on how much of these profits the company reinvests or "retains", and how effectively it does so, we are then able to assess a company’s earnings growth potential. Generally speaking, other things being equal, firms with a high return on equity and profit retention, have a higher growth rate than firms that don’t share these attributes.
A Side By Side comparison of Dr. Martens' Earnings Growth And 19% ROE
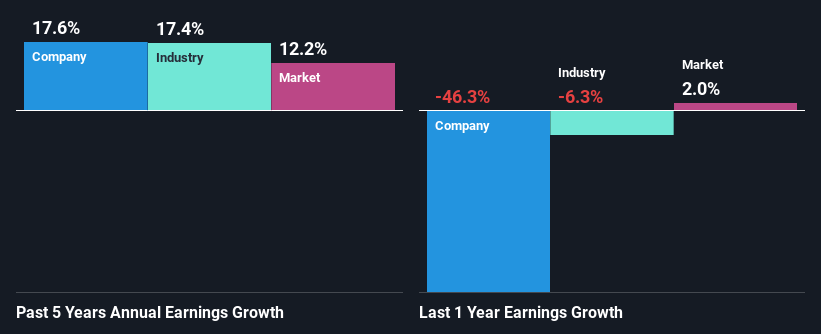
At first glance, Dr. Martens seems to have a decent ROE. Further, the company's ROE compares quite favorably to the industry average of 11%. Probably as a result of this, Dr. Martens was able to see a decent growth of 18% over the last five years.
We then performed a comparison between Dr. Martens' net income growth with the industry, which revealed that the company's growth is similar to the average industry growth of 17% in the same 5-year period.
The basis for attaching value to a company is, to a great extent, tied to its earnings growth. The investor should try to establish if the expected growth or decline in earnings, whichever the case may be, is priced in. By doing so, they will have an idea if the stock is headed into clear blue waters or if swampy waters await. Is DOCS fairly valued? This infographic on the company's intrinsic value has everything you need to know.
Is Dr. Martens Efficiently Re-investing Its Profits?
Dr. Martens has a healthy combination of a moderate three-year median payout ratio of 35% (or a retention ratio of 65%) and a respectable amount of growth in earnings as we saw above, meaning that the company has been making efficient use of its profits.
Moreover, Dr. Martens is determined to keep sharing its profits with shareholders which we infer from its long history of three years of paying a dividend. Our latest analyst data shows that the future payout ratio of the company over the next three years is expected to be approximately 37%. As a result, Dr. Martens' ROE is not expected to change by much either, which we inferred from the analyst estimate of 16% for future ROE.
Conclusion
In total, we are pretty happy with Dr. Martens' performance. In particular, it's great to see that the company is investing heavily into its business and along with a high rate of return, that has resulted in a sizeable growth in its earnings. Having said that, the company's earnings growth is expected to slow down, as forecasted in the current analyst estimates. To know more about the latest analysts predictions for the company, check out this visualization of analyst forecasts for the company.
New: Manage All Your Stock Portfolios in One Place
We've created the ultimate portfolio companion for stock investors, and it's free.
• Connect an unlimited number of Portfolios and see your total in one currency
• Be alerted to new Warning Signs or Risks via email or mobile
• Track the Fair Value of your stocks
Have feedback on this article? Concerned about the content? Get in touch with us directly. Alternatively, email editorial-team (at) simplywallst.com.
This article by Simply Wall St is general in nature. We provide commentary based on historical data and analyst forecasts only using an unbiased methodology and our articles are not intended to be financial advice. It does not constitute a recommendation to buy or sell any stock, and does not take account of your objectives, or your financial situation. We aim to bring you long-term focused analysis driven by fundamental data. Note that our analysis may not factor in the latest price-sensitive company announcements or qualitative material. Simply Wall St has no position in any stocks mentioned.
About LSE:DOCS
Dr. Martens
Engages in the design, development, procurement, marketing, sale, and distribution of footwear.
Excellent balance sheet and good value.
Similar Companies
Market Insights


Advertisement
Community Narratives
The Future of Drug Testing? Fingerprint Tech Shows Serious Promise
Fair Value US$2.98|40.3% undervalued
JO
Community Contributor
Suncorp’s Next Chapter: Insurance-Only and Ready to Grow
Fair Value AU$22.83|7.9% undervalued
RO
Community Contributor
Thyssenkrupp Nucera Will Achieve Double-Digit Profits by 2030 Boosted by Hydrogen Growth
Fair Value €14.40|31.6% undervalued
CH
Community Contributor
Tesla’s Nvidia Moment – The AI & Robotics Inflection Point
Fair Value US$359.72|12.3% undervalued
BL
Community Contributor