Stock Analysis
- United Kingdom
- /
- Consumer Durables
- /
- LSE:BKG
What Do The Returns On Capital At Berkeley Group Holdings (LON:BKG) Tell Us?


If you're not sure where to start when looking for the next multi-bagger, there are a few key trends you should keep an eye out for. Ideally, a business will show two trends; firstly a growing return on capital employed (ROCE) and secondly, an increasing amount of capital employed. This shows us that it's a compounding machine, able to continually reinvest its earnings back into the business and generate higher returns. However, after briefly looking over the numbers, we don't think Berkeley Group Holdings (LON:BKG) has the makings of a multi-bagger going forward, but let's have a look at why that may be.
Understanding Return On Capital Employed (ROCE)
If you haven't worked with ROCE before, it measures the 'return' (pre-tax profit) a company generates from capital employed in its business. Analysts use this formula to calculate it for Berkeley Group Holdings:
Return on Capital Employed = Earnings Before Interest and Tax (EBIT) ÷ (Total Assets - Current Liabilities)
0.12 = UK£441m ÷ (UK£5.6b - UK£1.8b) (Based on the trailing twelve months to October 2020).
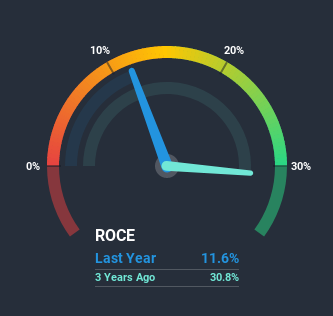
Therefore, Berkeley Group Holdings has an ROCE of 12%. On its own, that's a standard return, however it's much better than the 6.7% generated by the Consumer Durables industry.
View our latest analysis for Berkeley Group Holdings
In the above chart we have measured Berkeley Group Holdings' prior ROCE against its prior performance, but the future is arguably more important. If you'd like, you can check out the forecasts from the analysts covering Berkeley Group Holdings here for free.
So How Is Berkeley Group Holdings' ROCE Trending?
When we looked at the ROCE trend at Berkeley Group Holdings, we didn't gain much confidence. To be more specific, ROCE has fallen from 27% over the last five years. And considering revenue has dropped while employing more capital, we'd be cautious. If this were to continue, you might be looking at a company that is trying to reinvest for growth but is actually losing market share since sales haven't increased.
On a related note, Berkeley Group Holdings has decreased its current liabilities to 32% of total assets. That could partly explain why the ROCE has dropped. What's more, this can reduce some aspects of risk to the business because now the company's suppliers or short-term creditors are funding less of its operations. Some would claim this reduces the business' efficiency at generating ROCE since it is now funding more of the operations with its own money.The Bottom Line On Berkeley Group Holdings' ROCE
We're a bit apprehensive about Berkeley Group Holdings because despite more capital being deployed in the business, returns on that capital and sales have both fallen. Investors must expect better things on the horizon though because the stock has risen 38% in the last five years. Either way, we aren't huge fans of the current trends and so with that we think you might find better investments elsewhere.
On a separate note, we've found 2 warning signs for Berkeley Group Holdings you'll probably want to know about.
While Berkeley Group Holdings isn't earning the highest return, check out this free list of companies that are earning high returns on equity with solid balance sheets.
When trading Berkeley Group Holdings or any other investment, use the platform considered by many to be the Professional's Gateway to the Worlds Market, Interactive Brokers. You get the lowest-cost* trading on stocks, options, futures, forex, bonds and funds worldwide from a single integrated account. Promoted
Valuation is complex, but we're helping make it simple.
Find out whether Berkeley Group Holdings is potentially over or undervalued by checking out our comprehensive analysis, which includes fair value estimates, risks and warnings, dividends, insider transactions and financial health.
View the Free AnalysisThis article by Simply Wall St is general in nature. It does not constitute a recommendation to buy or sell any stock, and does not take account of your objectives, or your financial situation. We aim to bring you long-term focused analysis driven by fundamental data. Note that our analysis may not factor in the latest price-sensitive company announcements or qualitative material. Simply Wall St has no position in any stocks mentioned.
*Interactive Brokers Rated Lowest Cost Broker by StockBrokers.com Annual Online Review 2020
Have feedback on this article? Concerned about the content? Get in touch with us directly. Alternatively, email editorial-team@simplywallst.com.
About LSE:BKG
Berkeley Group Holdings
Engages in the residential-led and mixed-use property development and ancillary activities in the United Kingdom.
Excellent balance sheet and good value.
