
Advertisement
- United Kingdom
- /
- Consumer Durables
- /
- AIM:SDG
We Like These Underlying Return On Capital Trends At Sanderson Design Group (LON:SDG)
Did you know there are some financial metrics that can provide clues of a potential multi-bagger? One common approach is to try and find a company with returns on capital employed (ROCE) that are increasing, in conjunction with a growing amount of capital employed. Basically this means that a company has profitable initiatives that it can continue to reinvest in, which is a trait of a compounding machine. So when we looked at Sanderson Design Group (LON:SDG) and its trend of ROCE, we really liked what we saw.
Return On Capital Employed (ROCE): What Is It?
For those who don't know, ROCE is a measure of a company's yearly pre-tax profit (its return), relative to the capital employed in the business. To calculate this metric for Sanderson Design Group, this is the formula:
Return on Capital Employed = Earnings Before Interest and Tax (EBIT) ÷ (Total Assets - Current Liabilities)
0.14 = UK£12m ÷ (UK£106m - UK£22m) (Based on the trailing twelve months to January 2022).
Therefore, Sanderson Design Group has an ROCE of 14%. In absolute terms, that's a pretty normal return, and it's somewhat close to the Consumer Durables industry average of 12%.
Check out our latest analysis for Sanderson Design Group
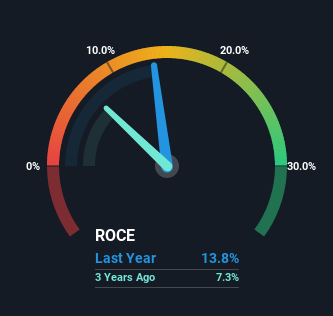
Above you can see how the current ROCE for Sanderson Design Group compares to its prior returns on capital, but there's only so much you can tell from the past. If you're interested, you can view the analysts predictions in our free report on analyst forecasts for the company.
What The Trend Of ROCE Can Tell Us
Sanderson Design Group is displaying some positive trends. The numbers show that in the last five years, the returns generated on capital employed have grown considerably to 14%. The company is effectively making more money per dollar of capital used, and it's worth noting that the amount of capital has increased too, by 30%. The increasing returns on a growing amount of capital is common amongst multi-baggers and that's why we're impressed.
On a related note, the company's ratio of current liabilities to total assets has decreased to 21%, which basically reduces it's funding from the likes of short-term creditors or suppliers. So this improvement in ROCE has come from the business' underlying economics, which is great to see.
In Conclusion...
All in all, it's terrific to see that Sanderson Design Group is reaping the rewards from prior investments and is growing its capital base. Given the stock has declined 56% in the last five years, this could be a good investment if the valuation and other metrics are also appealing. So researching this company further and determining whether or not these trends will continue seems justified.
One more thing, we've spotted 2 warning signs facing Sanderson Design Group that you might find interesting.
If you want to search for solid companies with great earnings, check out this free list of companies with good balance sheets and impressive returns on equity.
New: Manage All Your Stock Portfolios in One Place
We've created the ultimate portfolio companion for stock investors, and it's free.
• Connect an unlimited number of Portfolios and see your total in one currency
• Be alerted to new Warning Signs or Risks via email or mobile
• Track the Fair Value of your stocks
Have feedback on this article? Concerned about the content? Get in touch with us directly. Alternatively, email editorial-team (at) simplywallst.com.
This article by Simply Wall St is general in nature. We provide commentary based on historical data and analyst forecasts only using an unbiased methodology and our articles are not intended to be financial advice. It does not constitute a recommendation to buy or sell any stock, and does not take account of your objectives, or your financial situation. We aim to bring you long-term focused analysis driven by fundamental data. Note that our analysis may not factor in the latest price-sensitive company announcements or qualitative material. Simply Wall St has no position in any stocks mentioned.
About AIM:SDG
Sanderson Design Group
Engages in the design, manufacture, marketing, and distribution of interior furnishings, fabrics, and wallpapers worldwide.
Flawless balance sheet and undervalued.
Similar Companies
Market Insights

Advertisement
Community Narratives
MINISO's fair value is projected at 26.69 with an anticipated PE ratio shift of 20x
Fair Value US$24.03|11.0% undervalued
BE
Community Contributor
Procter & Gamble: A Dividend Giant Facing Slowing Growth
Fair Value US$119.81|23.3% overvalued
AN
Community Contributor
Eli Lilly's Future Growth Driven by Tirzepatide and Favorable Market Conditions
Fair Value US$1.19k|13.8% undervalued
EA
Community Contributor