- United Kingdom
- /
- Consumer Durables
- /
- AIM:IGR
IG Design Group plc (LON:IGR) Surges 35% Yet Its Low P/S Is No Reason For Excitement
IG Design Group plc (LON:IGR) shareholders would be excited to see that the share price has had a great month, posting a 35% gain and recovering from prior weakness. But the gains over the last month weren't enough to make shareholders whole, as the share price is still down 6.5% in the last twelve months.
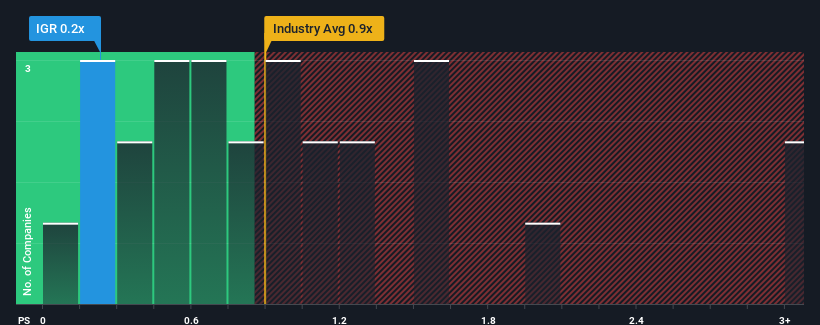
Even after such a large jump in price, considering around half the companies operating in the United Kingdom's Consumer Durables industry have price-to-sales ratios (or "P/S") above 0.9x, you may still consider IG Design Group as an solid investment opportunity with its 0.2x P/S ratio. Although, it's not wise to just take the P/S at face value as there may be an explanation why it's limited.
See our latest analysis for IG Design Group

How IG Design Group Has Been Performing
IG Design Group has been struggling lately as its revenue has declined faster than most other companies. It seems that many are expecting the dismal revenue performance to persist, which has repressed the P/S. You'd much rather the company improve its revenue performance if you still believe in the business. If not, then existing shareholders will probably struggle to get excited about the future direction of the share price.
If you'd like to see what analysts are forecasting going forward, you should check out our free report on IG Design Group.Do Revenue Forecasts Match The Low P/S Ratio?
In order to justify its P/S ratio, IG Design Group would need to produce sluggish growth that's trailing the industry.
Retrospectively, the last year delivered a frustrating 19% decrease to the company's top line. Regardless, revenue has managed to lift by a handy 8.5% in aggregate from three years ago, thanks to the earlier period of growth. So we can start by confirming that the company has generally done a good job of growing revenue over that time, even though it had some hiccups along the way.
Turning to the outlook, the next three years should generate growth of 2.4% each year as estimated by the three analysts watching the company. That's shaping up to be materially lower than the 5.5% each year growth forecast for the broader industry.
With this information, we can see why IG Design Group is trading at a P/S lower than the industry. It seems most investors are expecting to see limited future growth and are only willing to pay a reduced amount for the stock.
The Bottom Line On IG Design Group's P/S
Despite IG Design Group's share price climbing recently, its P/S still lags most other companies. Using the price-to-sales ratio alone to determine if you should sell your stock isn't sensible, however it can be a practical guide to the company's future prospects.
We've established that IG Design Group maintains its low P/S on the weakness of its forecast growth being lower than the wider industry, as expected. At this stage investors feel the potential for an improvement in revenue isn't great enough to justify a higher P/S ratio. Unless these conditions improve, they will continue to form a barrier for the share price around these levels.
It is also worth noting that we have found 2 warning signs for IG Design Group (1 is a bit unpleasant!) that you need to take into consideration.
Of course, profitable companies with a history of great earnings growth are generally safer bets. So you may wish to see this free collection of other companies that have reasonable P/E ratios and have grown earnings strongly.
New: AI Stock Screener & Alerts
Our new AI Stock Screener scans the market every day to uncover opportunities.
• Dividend Powerhouses (3%+ Yield)
• Undervalued Small Caps with Insider Buying
• High growth Tech and AI Companies
Or build your own from over 50 metrics.
Have feedback on this article? Concerned about the content? Get in touch with us directly. Alternatively, email editorial-team (at) simplywallst.com.
This article by Simply Wall St is general in nature. We provide commentary based on historical data and analyst forecasts only using an unbiased methodology and our articles are not intended to be financial advice. It does not constitute a recommendation to buy or sell any stock, and does not take account of your objectives, or your financial situation. We aim to bring you long-term focused analysis driven by fundamental data. Note that our analysis may not factor in the latest price-sensitive company announcements or qualitative material. Simply Wall St has no position in any stocks mentioned.
About AIM:IGR
IG Design Group
Engages in the design, production, and distribution of gift packaging, arty, goods not for resale, craft, stationery, and homeware consumable products in the Americas, the United Kingdom, Netherlands, and internationally.
Fair value with mediocre balance sheet.
Market Insights
Community Narratives


