
Advertisement
- United Kingdom
- /
- Professional Services
- /
- LSE:CPI
Capita plc's (LON:CPI) Intrinsic Value Is Potentially 37% Above Its Share Price
Key Insights
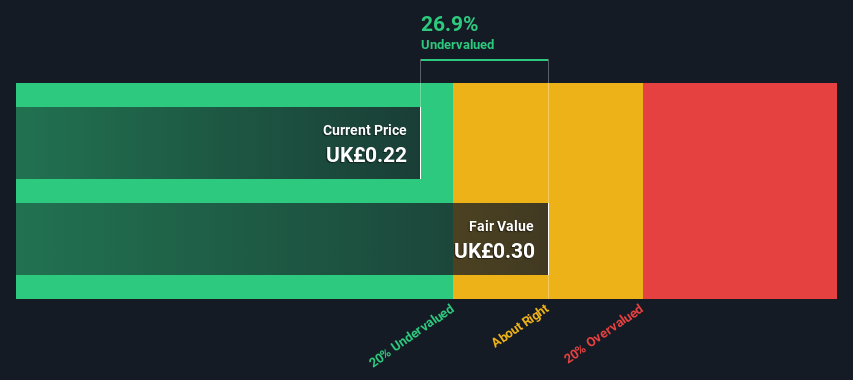
- Capita's estimated fair value is UK£0.30 based on 2 Stage Free Cash Flow to Equity
- Capita is estimated to be 27% undervalued based on current share price of UK£0.22
- Our fair value estimate is 34% lower than Capita's analyst price target of UK£0.46
Today we will run through one way of estimating the intrinsic value of Capita plc (LON:CPI) by estimating the company's future cash flows and discounting them to their present value. Our analysis will employ the Discounted Cash Flow (DCF) model. Models like these may appear beyond the comprehension of a lay person, but they're fairly easy to follow.
Remember though, that there are many ways to estimate a company's value, and a DCF is just one method. Anyone interested in learning a bit more about intrinsic value should have a read of the Simply Wall St analysis model.
Check out our latest analysis for Capita
The Model
We are going to use a two-stage DCF model, which, as the name states, takes into account two stages of growth. The first stage is generally a higher growth period which levels off heading towards the terminal value, captured in the second 'steady growth' period. To begin with, we have to get estimates of the next ten years of cash flows. Where possible we use analyst estimates, but when these aren't available we extrapolate the previous free cash flow (FCF) from the last estimate or reported value. We assume companies with shrinking free cash flow will slow their rate of shrinkage, and that companies with growing free cash flow will see their growth rate slow, over this period. We do this to reflect that growth tends to slow more in the early years than it does in later years.
Generally we assume that a dollar today is more valuable than a dollar in the future, so we discount the value of these future cash flows to their estimated value in today's dollars:
10-year free cash flow (FCF) estimate
| 2024 | 2025 | 2026 | 2027 | 2028 | 2029 | 2030 | 2031 | 2032 | 2033 | |
| Levered FCF (£, Millions) | UK£10.2m | UK£37.9m | UK£51.5m | UK£64.6m | UK£76.3m | UK£86.3m | UK£94.5m | UK£101.2m | UK£106.5m | UK£110.9m |
| Growth Rate Estimate Source | Analyst x3 | Analyst x3 | Est @ 35.79% | Est @ 25.43% | Est @ 18.17% | Est @ 13.09% | Est @ 9.54% | Est @ 7.05% | Est @ 5.31% | Est @ 4.09% |
| Present Value (£, Millions) Discounted @ 15% | UK£8.8 | UK£28.6 | UK£33.7 | UK£36.7 | UK£37.7 | UK£37.1 | UK£35.3 | UK£32.8 | UK£30.0 | UK£27.1 |
("Est" = FCF growth rate estimated by Simply Wall St)
Present Value of 10-year Cash Flow (PVCF) = UK£308m
After calculating the present value of future cash flows in the initial 10-year period, we need to calculate the Terminal Value, which accounts for all future cash flows beyond the first stage. The Gordon Growth formula is used to calculate Terminal Value at a future annual growth rate equal to the 5-year average of the 10-year government bond yield of 1.2%. We discount the terminal cash flows to today's value at a cost of equity of 15%.
Terminal Value (TV)= FCF2033 × (1 + g) ÷ (r – g) = UK£111m× (1 + 1.2%) ÷ (15%– 1.2%) = UK£808m
Present Value of Terminal Value (PVTV)= TV / (1 + r)10= UK£808m÷ ( 1 + 15%)10= UK£198m
The total value, or equity value, is then the sum of the present value of the future cash flows, which in this case is UK£506m. To get the intrinsic value per share, we divide this by the total number of shares outstanding. Compared to the current share price of UK£0.2, the company appears a touch undervalued at a 27% discount to where the stock price trades currently. Valuations are imprecise instruments though, rather like a telescope - move a few degrees and end up in a different galaxy. Do keep this in mind.
The Assumptions
We would point out that the most important inputs to a discounted cash flow are the discount rate and of course the actual cash flows. If you don't agree with these result, have a go at the calculation yourself and play with the assumptions. The DCF also does not consider the possible cyclicality of an industry, or a company's future capital requirements, so it does not give a full picture of a company's potential performance. Given that we are looking at Capita as potential shareholders, the cost of equity is used as the discount rate, rather than the cost of capital (or weighted average cost of capital, WACC) which accounts for debt. In this calculation we've used 15%, which is based on a levered beta of 1.992. Beta is a measure of a stock's volatility, compared to the market as a whole. We get our beta from the industry average beta of globally comparable companies, with an imposed limit between 0.8 and 2.0, which is a reasonable range for a stable business.
SWOT Analysis for Capita
Strength
- Net debt to equity ratio below 40%.
Weakness
- Earnings declined over the past year.
- Interest payments on debt are not well covered.
Opportunity
- Annual earnings are forecast to grow for the next 3 years.
- Good value based on P/E ratio and estimated fair value.
Threat
- Debt is not well covered by operating cash flow.
- Annual earnings are forecast to grow slower than the British market.
Moving On:
Although the valuation of a company is important, it shouldn't be the only metric you look at when researching a company. The DCF model is not a perfect stock valuation tool. Rather it should be seen as a guide to "what assumptions need to be true for this stock to be under/overvalued?" For example, changes in the company's cost of equity or the risk free rate can significantly impact the valuation. Why is the intrinsic value higher than the current share price? For Capita, we've compiled three relevant aspects you should explore:
- Risks: Every company has them, and we've spotted 2 warning signs for Capita you should know about.
- Management:Have insiders been ramping up their shares to take advantage of the market's sentiment for CPI's future outlook? Check out our management and board analysis with insights on CEO compensation and governance factors.
- Other High Quality Alternatives: Do you like a good all-rounder? Explore our interactive list of high quality stocks to get an idea of what else is out there you may be missing!
PS. The Simply Wall St app conducts a discounted cash flow valuation for every stock on the LSE every day. If you want to find the calculation for other stocks just search here.
New: AI Stock Screener & Alerts
Our new AI Stock Screener scans the market every day to uncover opportunities.
• Dividend Powerhouses (3%+ Yield)
• Undervalued Small Caps with Insider Buying
• High growth Tech and AI Companies
Or build your own from over 50 metrics.
Have feedback on this article? Concerned about the content? Get in touch with us directly. Alternatively, email editorial-team (at) simplywallst.com.
This article by Simply Wall St is general in nature. We provide commentary based on historical data and analyst forecasts only using an unbiased methodology and our articles are not intended to be financial advice. It does not constitute a recommendation to buy or sell any stock, and does not take account of your objectives, or your financial situation. We aim to bring you long-term focused analysis driven by fundamental data. Note that our analysis may not factor in the latest price-sensitive company announcements or qualitative material. Simply Wall St has no position in any stocks mentioned.
About LSE:CPI
Capita
Operates an outsourcer that supports clients across the public and private sectors in the United Kingdom and rest of Europe.
Reasonable growth potential and fair value.
Similar Companies
Market Insights

Advertisement
Community Narratives
MINISO's fair value is projected at 26.69 with an anticipated PE ratio shift of 20x
Fair Value US$24.03|11.0% undervalued
BE
Community Contributor
Procter & Gamble: A Dividend Giant Facing Slowing Growth
Fair Value US$119.81|23.3% overvalued
AN
Community Contributor
Eli Lilly's Future Growth Driven by Tirzepatide and Favorable Market Conditions
Fair Value US$1.19k|13.8% undervalued
EA
Community Contributor