- United Kingdom
- /
- Aerospace & Defense
- /
- LSE:BAB
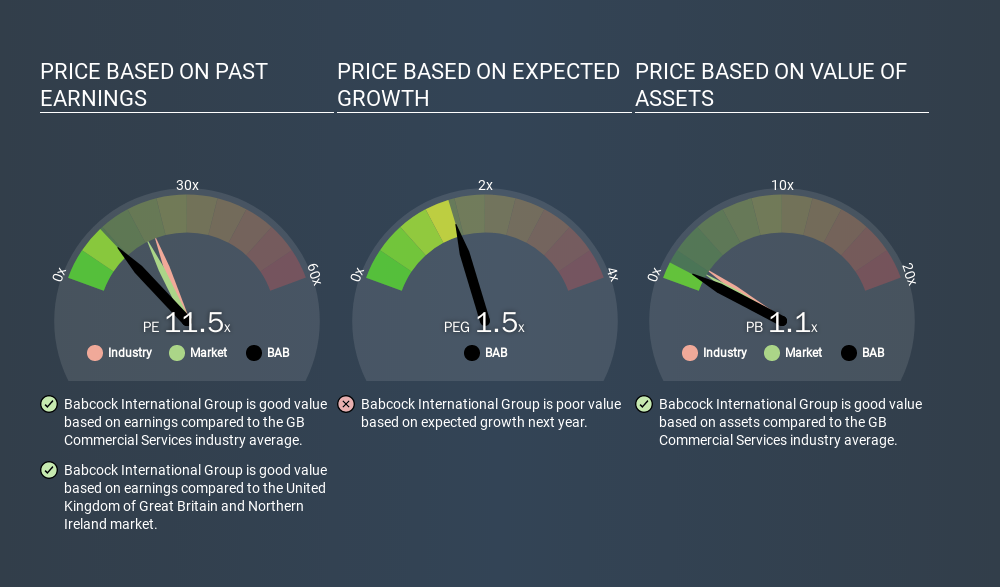
Do You Like Babcock International Group PLC (LON:BAB) At This P/E Ratio?


This article is for investors who would like to improve their understanding of price to earnings ratios (P/E ratios). We'll look at Babcock International Group PLC's (LON:BAB) P/E ratio and reflect on what it tells us about the company's share price. Babcock International Group has a price to earnings ratio of 11.45, based on the last twelve months. That corresponds to an earnings yield of approximately 8.7%.
Check out our latest analysis for Babcock International Group
How Do You Calculate A P/E Ratio?
The formula for P/E is:
Price to Earnings Ratio = Price per Share ÷ Earnings per Share (EPS)
Or for Babcock International Group:
P/E of 11.45 = GBP6.13 ÷ GBP0.54 (Based on the year to September 2019.)
Is A High Price-to-Earnings Ratio Good?
A higher P/E ratio means that buyers have to pay a higher price for each GBP1 the company has earned over the last year. All else being equal, it's better to pay a low price -- but as Warren Buffett said, 'It's far better to buy a wonderful company at a fair price than a fair company at a wonderful price'.
How Does Babcock International Group's P/E Ratio Compare To Its Peers?
We can get an indication of market expectations by looking at the P/E ratio. We can see in the image below that the average P/E (21.0) for companies in the commercial services industry is higher than Babcock International Group's P/E.
This suggests that market participants think Babcock International Group will underperform other companies in its industry. Many investors like to buy stocks when the market is pessimistic about their prospects. If you consider the stock interesting, further research is recommended. For example, I often monitor director buying and selling.
How Growth Rates Impact P/E Ratios
When earnings fall, the 'E' decreases, over time. That means even if the current P/E is low, it will increase over time if the share price stays flat. A higher P/E should indicate the stock is expensive relative to others -- and that may encourage shareholders to sell.
It's great to see that Babcock International Group grew EPS by 12% in the last year. And it has bolstered its earnings per share by 3.3% per year over the last five years. So one might expect an above average P/E ratio. In contrast, EPS has decreased by 4.0%, annually, over 3 years.
A Limitation: P/E Ratios Ignore Debt and Cash In The Bank
One drawback of using a P/E ratio is that it considers market capitalization, but not the balance sheet. In other words, it does not consider any debt or cash that the company may have on the balance sheet. Hypothetically, a company could reduce its future P/E ratio by spending its cash (or taking on debt) to achieve higher earnings.
Spending on growth might be good or bad a few years later, but the point is that the P/E ratio does not account for the option (or lack thereof).
Is Debt Impacting Babcock International Group's P/E?
Babcock International Group's net debt equates to 44% of its market capitalization. While that's enough to warrant consideration, it doesn't really concern us.
The Verdict On Babcock International Group's P/E Ratio
Babcock International Group trades on a P/E ratio of 11.5, which is below the GB market average of 18.4. The company hasn't stretched its balance sheet, and earnings growth was good last year. The low P/E ratio suggests current market expectations are muted, implying these levels of growth will not continue.
Investors have an opportunity when market expectations about a stock are wrong. If the reality for a company is not as bad as the P/E ratio indicates, then the share price should increase as the market realizes this. So this free visualization of the analyst consensus on future earnings could help you make the right decision about whether to buy, sell, or hold.
You might be able to find a better buy than Babcock International Group. If you want a selection of possible winners, check out this free list of interesting companies that trade on a P/E below 20 (but have proven they can grow earnings).
If you spot an error that warrants correction, please contact the editor at editorial-team@simplywallst.com. This article by Simply Wall St is general in nature. It does not constitute a recommendation to buy or sell any stock, and does not take account of your objectives, or your financial situation. Simply Wall St has no position in the stocks mentioned.
We aim to bring you long-term focused research analysis driven by fundamental data. Note that our analysis may not factor in the latest price-sensitive company announcements or qualitative material. Thank you for reading.
About LSE:BAB
Babcock International Group
Engages in the design, development, manufacture, and integration of specialist systems for aerospace, defense, and security in the United Kingdom, rest of Europe, Africa, North America, Australasia, and internationally.
Solid track record and good value.
Similar Companies
Market Insights

Community Narratives

