
Advertisement
- United Kingdom
- /
- Professional Services
- /
- AIM:NBB
Further Upside For Norman Broadbent plc (LON:NBB) Shares Could Introduce Price Risks After 31% Bounce

Despite an already strong run, Norman Broadbent plc (LON:NBB) shares have been powering on, with a gain of 31% in the last thirty days. Unfortunately, the gains of the last month did little to right the losses of the last year with the stock still down 20% over that time.
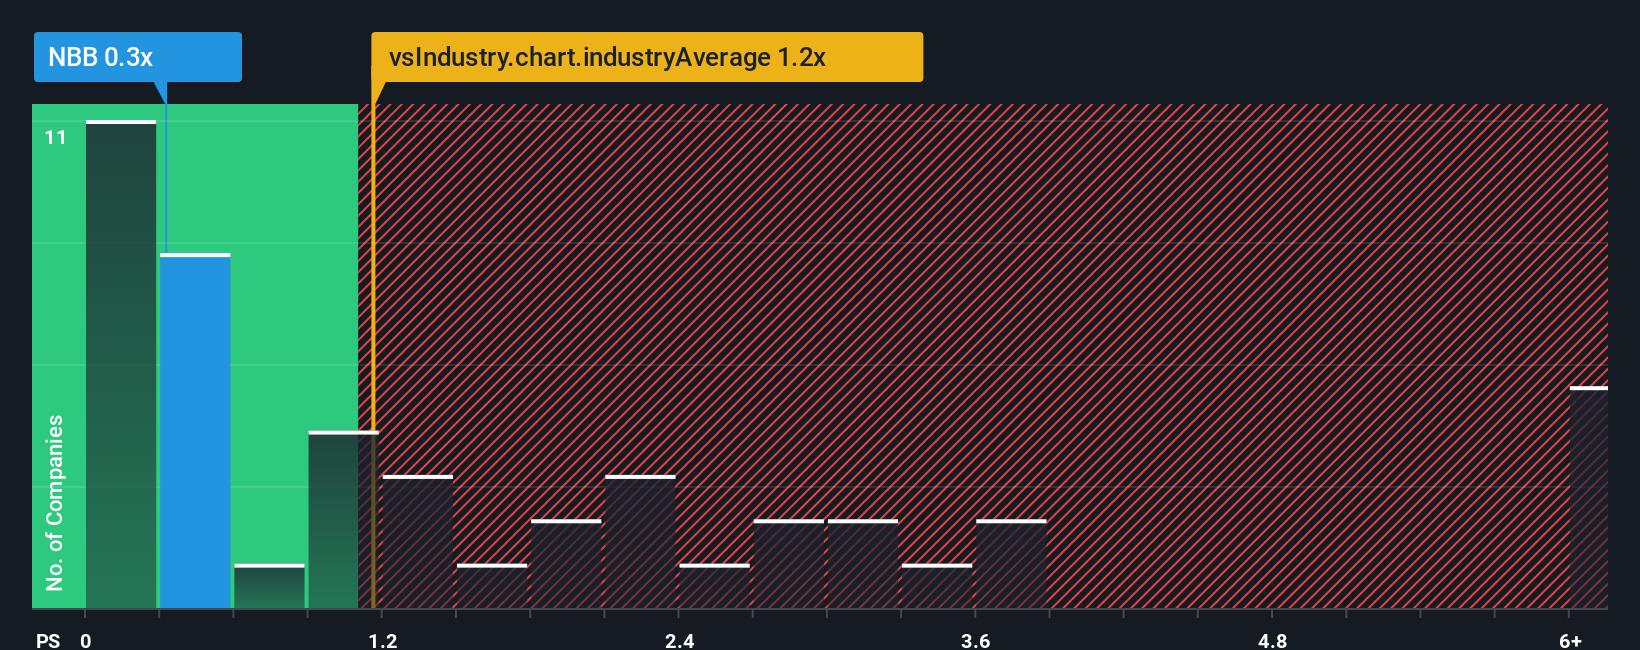
In spite of the firm bounce in price, it would still be understandable if you think Norman Broadbent is a stock with good investment prospects with a price-to-sales ratios (or "P/S") of 0.3x, considering almost half the companies in the United Kingdom's Professional Services industry have P/S ratios above 1.2x. Although, it's not wise to just take the P/S at face value as there may be an explanation why it's limited.
Check out our latest analysis for Norman Broadbent
What Does Norman Broadbent's Recent Performance Look Like?
For instance, Norman Broadbent's receding revenue in recent times would have to be some food for thought. It might be that many expect the disappointing revenue performance to continue or accelerate, which has repressed the P/S. Those who are bullish on Norman Broadbent will be hoping that this isn't the case so that they can pick up the stock at a lower valuation.
Although there are no analyst estimates available for Norman Broadbent, take a look at this free data-rich visualisation to see how the company stacks up on earnings, revenue and cash flow.Is There Any Revenue Growth Forecasted For Norman Broadbent?
The only time you'd be truly comfortable seeing a P/S as low as Norman Broadbent's is when the company's growth is on track to lag the industry.
Taking a look back first, the company's revenue growth last year wasn't something to get excited about as it posted a disappointing decline of 11%. However, a few very strong years before that means that it was still able to grow revenue by an impressive 67% in total over the last three years. Accordingly, while they would have preferred to keep the run going, shareholders would definitely welcome the medium-term rates of revenue growth.
Comparing that to the industry, which is only predicted to deliver 6.0% growth in the next 12 months, the company's momentum is stronger based on recent medium-term annualised revenue results.
With this in mind, we find it intriguing that Norman Broadbent's P/S isn't as high compared to that of its industry peers. It looks like most investors are not convinced the company can maintain its recent growth rates.
What We Can Learn From Norman Broadbent's P/S?
The latest share price surge wasn't enough to lift Norman Broadbent's P/S close to the industry median. Using the price-to-sales ratio alone to determine if you should sell your stock isn't sensible, however it can be a practical guide to the company's future prospects.
We're very surprised to see Norman Broadbent currently trading on a much lower than expected P/S since its recent three-year growth is higher than the wider industry forecast. When we see robust revenue growth that outpaces the industry, we presume that there are notable underlying risks to the company's future performance, which is exerting downward pressure on the P/S ratio. At least price risks look to be very low if recent medium-term revenue trends continue, but investors seem to think future revenue could see a lot of volatility.
There are also other vital risk factors to consider before investing and we've discovered 2 warning signs for Norman Broadbent that you should be aware of.
If these risks are making you reconsider your opinion on Norman Broadbent, explore our interactive list of high quality stocks to get an idea of what else is out there.
Valuation is complex, but we're here to simplify it.
Discover if Norman Broadbent might be undervalued or overvalued with our detailed analysis, featuring fair value estimates, potential risks, dividends, insider trades, and its financial condition.
Access Free AnalysisHave feedback on this article? Concerned about the content? Get in touch with us directly. Alternatively, email editorial-team (at) simplywallst.com.
This article by Simply Wall St is general in nature. We provide commentary based on historical data and analyst forecasts only using an unbiased methodology and our articles are not intended to be financial advice. It does not constitute a recommendation to buy or sell any stock, and does not take account of your objectives, or your financial situation. We aim to bring you long-term focused analysis driven by fundamental data. Note that our analysis may not factor in the latest price-sensitive company announcements or qualitative material. Simply Wall St has no position in any stocks mentioned.
About AIM:NBB
Norman Broadbent
Provides professional services in the United Kingdom and internationally.
Mediocre balance sheet very low.
Similar Companies
Market Insights


Advertisement
Community Narratives
For the Emperor: Why Games Workshop Could Be a Star Investment
Fair Value UK£160.00|0.5% overvalued
RO
Community Contributor
Securitas will boost margins with AI and tech-driven services
Fair Value SEK 260.91|44.5% undervalued
UN
Community Contributor
A Leader in EV Charging with Growth Potential
Fair Value €27.00|18.7% undervalued
TI
Community Contributor