
Advertisement
Some say volatility, rather than debt, is the best way to think about risk as an investor, but Warren Buffett famously said that 'Volatility is far from synonymous with risk.' So it might be obvious that you need to consider debt, when you think about how risky any given stock is, because too much debt can sink a company. Importantly, Grafenia Plc (LON:GRA) does carry debt. But should shareholders be worried about its use of debt?
When Is Debt Dangerous?
Debt is a tool to help businesses grow, but if a business is incapable of paying off its lenders, then it exists at their mercy. If things get really bad, the lenders can take control of the business. However, a more common (but still painful) scenario is that it has to raise new equity capital at a low price, thus permanently diluting shareholders. Of course, the upside of debt is that it often represents cheap capital, especially when it replaces dilution in a company with the ability to reinvest at high rates of return. When we examine debt levels, we first consider both cash and debt levels, together.
View our latest analysis for Grafenia
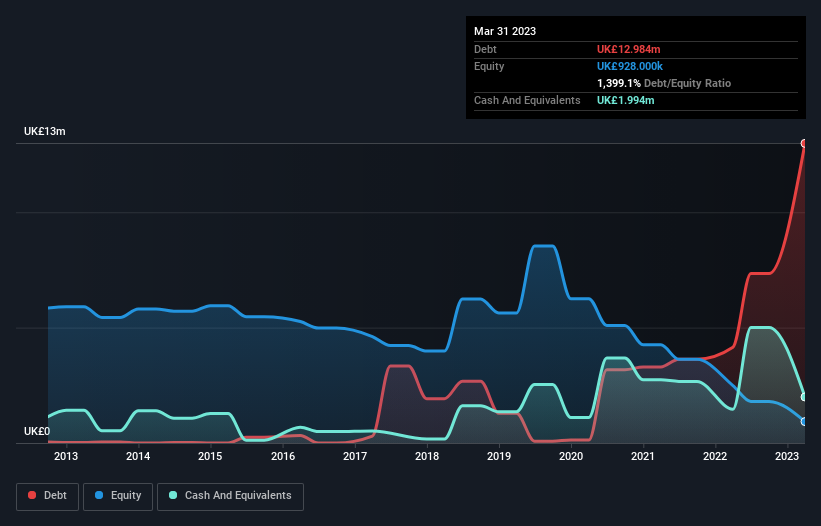
What Is Grafenia's Debt?
The image below, which you can click on for greater detail, shows that at March 2023 Grafenia had debt of UK£13.0m, up from UK£4.15m in one year. However, it also had UK£1.99m in cash, and so its net debt is UK£11.0m.
A Look At Grafenia's Liabilities
According to the last reported balance sheet, Grafenia had liabilities of UK£5.88m due within 12 months, and liabilities of UK£16.8m due beyond 12 months. On the other hand, it had cash of UK£1.99m and UK£3.84m worth of receivables due within a year. So its liabilities total UK£16.9m more than the combination of its cash and short-term receivables.
When you consider that this deficiency exceeds the company's UK£12.2m market capitalization, you might well be inclined to review the balance sheet intently. In the scenario where the company had to clean up its balance sheet quickly, it seems likely shareholders would suffer extensive dilution. The balance sheet is clearly the area to focus on when you are analysing debt. But you can't view debt in total isolation; since Grafenia will need earnings to service that debt. So if you're keen to discover more about its earnings, it might be worth checking out this graph of its long term earnings trend.
In the last year Grafenia wasn't profitable at an EBIT level, but managed to grow its revenue by 31%, to UK£12m. With any luck the company will be able to grow its way to profitability.
Caveat Emptor
Even though Grafenia managed to grow its top line quite deftly, the cold hard truth is that it is losing money on the EBIT line. To be specific the EBIT loss came in at UK£798k. Considering that alongside the liabilities mentioned above make us nervous about the company. It would need to improve its operations quickly for us to be interested in it. Not least because it burned through UK£142k in negative free cash flow over the last year. That means it's on the risky side of things. The balance sheet is clearly the area to focus on when you are analysing debt. But ultimately, every company can contain risks that exist outside of the balance sheet. Be aware that Grafenia is showing 1 warning sign in our investment analysis , you should know about...
When all is said and done, sometimes its easier to focus on companies that don't even need debt. Readers can access a list of growth stocks with zero net debt 100% free, right now.
New: Manage All Your Stock Portfolios in One Place
We've created the ultimate portfolio companion for stock investors, and it's free.
• Connect an unlimited number of Portfolios and see your total in one currency
• Be alerted to new Warning Signs or Risks via email or mobile
• Track the Fair Value of your stocks
Have feedback on this article? Concerned about the content? Get in touch with us directly. Alternatively, email editorial-team (at) simplywallst.com.
This article by Simply Wall St is general in nature. We provide commentary based on historical data and analyst forecasts only using an unbiased methodology and our articles are not intended to be financial advice. It does not constitute a recommendation to buy or sell any stock, and does not take account of your objectives, or your financial situation. We aim to bring you long-term focused analysis driven by fundamental data. Note that our analysis may not factor in the latest price-sensitive company announcements or qualitative material. Simply Wall St has no position in any stocks mentioned.
About AIM:SFT
Software Circle
Software Circle plc, together with its subsidiaries, licenses various software in the United Kingdom, Ireland, Europe, Belgium, the Netherlands, France, New Zealand, South Africa, and the United States.
Excellent balance sheet with weak fundamentals.
Market Insights

Advertisement
Community Narratives
Finding The True Value Of A Logistics Powerhouse
Fair Value US$95.21|7.5% undervalued
NV
Community Contributor
Paradigm Biopharmaceuticals Will Lead Osteoarthritis Treatment with Zilosul's FDA Success
Fair Value AU$5.50|91.8% undervalued
AM
Community Contributor
Barrick Mining (ABX:CA): A Gold Hedge against a U.S. Shutdown
Fair Value CA$60.00|26.4% undervalued
GM
Community Contributor