
Advertisement

Want to participate in a short research study? Help shape the future of investing tools and you could win a $250 gift card!
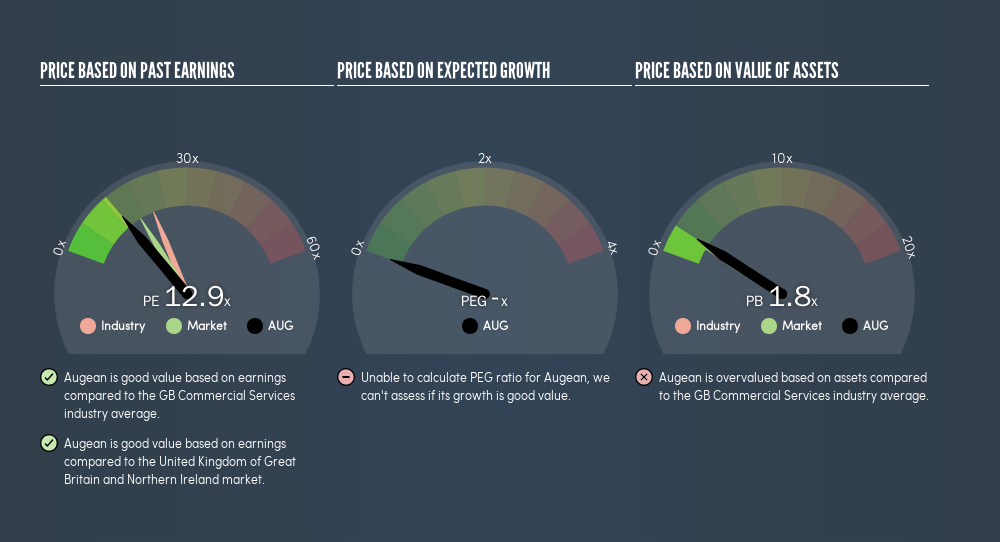
Today, we'll introduce the concept of the P/E ratio for those who are learning about investing. We'll show how you can use Augean plc's (LON:AUG) P/E ratio to inform your assessment of the investment opportunity. Based on the last twelve months, Augean's P/E ratio is 12.94. That corresponds to an earnings yield of approximately 7.7%.
See our latest analysis for Augean
How Do You Calculate A P/E Ratio?
The formula for price to earnings is:
Price to Earnings Ratio = Price per Share ÷ Earnings per Share (EPS)
Or for Augean:
P/E of 12.94 = £1.07 ÷ £0.083 (Based on the year to December 2018.)
Is A High P/E Ratio Good?
A higher P/E ratio means that buyers have to pay a higher price for each £1 the company has earned over the last year. All else being equal, it's better to pay a low price -- but as Warren Buffett said, 'It's far better to buy a wonderful company at a fair price than a fair company at a wonderful price.'
How Growth Rates Impact P/E Ratios
Probably the most important factor in determining what P/E a company trades on is the earnings growth. That's because companies that grow earnings per share quickly will rapidly increase the 'E' in the equation. That means even if the current P/E is high, it will reduce over time if the share price stays flat. And as that P/E ratio drops, the company will look cheap, unless its share price increases.
Augean's 113% EPS improvement over the last year was like bamboo growth after rain; rapid and impressive. The cherry on top is that the five year growth rate was an impressive 21% per year. With that kind of growth rate we would generally expect a high P/E ratio.
How Does Augean's P/E Ratio Compare To Its Peers?
The P/E ratio essentially measures market expectations of a company. The image below shows that Augean has a lower P/E than the average (20.5) P/E for companies in the commercial services industry.
This suggests that market participants think Augean will underperform other companies in its industry. While current expectations are low, the stock could be undervalued if the situation is better than the market assumes. You should delve deeper. I like to check if company insiders have been buying or selling.
Don't Forget: The P/E Does Not Account For Debt or Bank Deposits
The 'Price' in P/E reflects the market capitalization of the company. That means it doesn't take debt or cash into account. Theoretically, a business can improve its earnings (and produce a lower P/E in the future) by investing in growth. That means taking on debt (or spending its cash).
Such expenditure might be good or bad, in the long term, but the point here is that the balance sheet is not reflected by this ratio.
So What Does Augean's Balance Sheet Tell Us?
The extra options and safety that comes with Augean's UK£8.2m net cash position means that it deserves a higher P/E than it would if it had a lot of net debt.
The Verdict On Augean's P/E Ratio
Augean trades on a P/E ratio of 12.9, which is below the GB market average of 16.4. Not only should the net cash position reduce risk, but the recent growth has been impressive. The below average P/E ratio suggests that market participants don't believe the strong growth will continue.
When the market is wrong about a stock, it gives savvy investors an opportunity. If the reality for a company is not as bad as the P/E ratio indicates, then the share price should increase as the market realizes this. So this freevisual report on analyst forecasts could hold the key to an excellent investment decision.
Of course you might be able to find a better stock than Augean. So you may wish to see this freecollection of other companies that have grown earnings strongly.
We aim to bring you long-term focused research analysis driven by fundamental data. Note that our analysis may not factor in the latest price-sensitive company announcements or qualitative material.
If you spot an error that warrants correction, please contact the editor at editorial-team@simplywallst.com. This article by Simply Wall St is general in nature. It does not constitute a recommendation to buy or sell any stock, and does not take account of your objectives, or your financial situation. Simply Wall St has no position in the stocks mentioned. Thank you for reading.
Market Insights


Advertisement
Community Narratives
For the Emperor: Why Games Workshop Could Be a Star Investment
Fair Value UK£160.00|0.4% undervalued
RO
Community Contributor
Securitas will boost margins with AI and tech-driven services
Fair Value SEK 260.91|45.0% undervalued
UN
Community Contributor
A Leader in EV Charging with Growth Potential
Fair Value €27.00|20.4% undervalued
TI
Community Contributor