
Advertisement
- United Kingdom
- /
- Machinery
- /
- LSE:VSVS
Vesuvius plc's (LON:VSVS) Intrinsic Value Is Potentially 28% Above Its Share Price

Key Insights
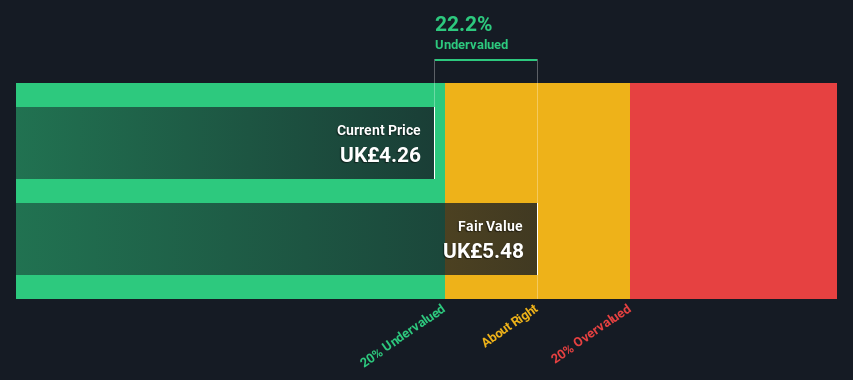
- Using the 2 Stage Free Cash Flow to Equity, Vesuvius fair value estimate is UK£5.48
- Current share price of UK£4.26 suggests Vesuvius is potentially 22% undervalued
- The UK£5.11 analyst price target for VSVS is 6.6% less than our estimate of fair value
Today we'll do a simple run through of a valuation method used to estimate the attractiveness of Vesuvius plc (LON:VSVS) as an investment opportunity by taking the forecast future cash flows of the company and discounting them back to today's value. One way to achieve this is by employing the Discounted Cash Flow (DCF) model. Believe it or not, it's not too difficult to follow, as you'll see from our example!
We would caution that there are many ways of valuing a company and, like the DCF, each technique has advantages and disadvantages in certain scenarios. For those who are keen learners of equity analysis, the Simply Wall St analysis model here may be something of interest to you.
View our latest analysis for Vesuvius
Crunching The Numbers
We use what is known as a 2-stage model, which simply means we have two different periods of growth rates for the company's cash flows. Generally the first stage is higher growth, and the second stage is a lower growth phase. To begin with, we have to get estimates of the next ten years of cash flows. Where possible we use analyst estimates, but when these aren't available we extrapolate the previous free cash flow (FCF) from the last estimate or reported value. We assume companies with shrinking free cash flow will slow their rate of shrinkage, and that companies with growing free cash flow will see their growth rate slow, over this period. We do this to reflect that growth tends to slow more in the early years than it does in later years.
Generally we assume that a dollar today is more valuable than a dollar in the future, so we need to discount the sum of these future cash flows to arrive at a present value estimate:
10-year free cash flow (FCF) forecast
| 2024 | 2025 | 2026 | 2027 | 2028 | 2029 | 2030 | 2031 | 2032 | 2033 | |
| Levered FCF (£, Millions) | UK£122.9m | UK£137.0m | UK£125.8m | UK£119.1m | UK£115.2m | UK£113.1m | UK£112.2m | UK£112.1m | UK£112.5m | UK£113.3m |
| Growth Rate Estimate Source | Analyst x6 | Analyst x5 | Est @ -8.22% | Est @ -5.30% | Est @ -3.25% | Est @ -1.82% | Est @ -0.82% | Est @ -0.12% | Est @ 0.37% | Est @ 0.72% |
| Present Value (£, Millions) Discounted @ 8.7% | UK£113 | UK£116 | UK£97.9 | UK£85.3 | UK£75.9 | UK£68.5 | UK£62.5 | UK£57.4 | UK£53.0 | UK£49.1 |
("Est" = FCF growth rate estimated by Simply Wall St)
Present Value of 10-year Cash Flow (PVCF) = UK£779m
We now need to calculate the Terminal Value, which accounts for all the future cash flows after this ten year period. The Gordon Growth formula is used to calculate Terminal Value at a future annual growth rate equal to the 5-year average of the 10-year government bond yield of 1.5%. We discount the terminal cash flows to today's value at a cost of equity of 8.7%.
Terminal Value (TV)= FCF2033 × (1 + g) ÷ (r – g) = UK£113m× (1 + 1.5%) ÷ (8.7%– 1.5%) = UK£1.6b
Present Value of Terminal Value (PVTV)= TV / (1 + r)10= UK£1.6b÷ ( 1 + 8.7%)10= UK£693m
The total value, or equity value, is then the sum of the present value of the future cash flows, which in this case is UK£1.5b. To get the intrinsic value per share, we divide this by the total number of shares outstanding. Relative to the current share price of UK£4.3, the company appears a touch undervalued at a 22% discount to where the stock price trades currently. Remember though, that this is just an approximate valuation, and like any complex formula - garbage in, garbage out.
Important Assumptions
The calculation above is very dependent on two assumptions. The first is the discount rate and the other is the cash flows. You don't have to agree with these inputs, I recommend redoing the calculations yourself and playing with them. The DCF also does not consider the possible cyclicality of an industry, or a company's future capital requirements, so it does not give a full picture of a company's potential performance. Given that we are looking at Vesuvius as potential shareholders, the cost of equity is used as the discount rate, rather than the cost of capital (or weighted average cost of capital, WACC) which accounts for debt. In this calculation we've used 8.7%, which is based on a levered beta of 1.218. Beta is a measure of a stock's volatility, compared to the market as a whole. We get our beta from the industry average beta of globally comparable companies, with an imposed limit between 0.8 and 2.0, which is a reasonable range for a stable business.
SWOT Analysis for Vesuvius
Strength
- Earnings growth over the past year exceeded its 5-year average.
- Debt is not viewed as a risk.
- Dividends are covered by earnings and cash flows.
Weakness
- Earnings growth over the past year underperformed the Machinery industry.
- Dividend is low compared to the top 25% of dividend payers in the Machinery market.
Opportunity
- Good value based on P/E ratio and estimated fair value.
Threat
- Annual earnings are forecast to decline for the next 3 years.
Looking Ahead:
Valuation is only one side of the coin in terms of building your investment thesis, and it ideally won't be the sole piece of analysis you scrutinize for a company. DCF models are not the be-all and end-all of investment valuation. Instead the best use for a DCF model is to test certain assumptions and theories to see if they would lead to the company being undervalued or overvalued. For instance, if the terminal value growth rate is adjusted slightly, it can dramatically alter the overall result. Can we work out why the company is trading at a discount to intrinsic value? For Vesuvius, we've compiled three important elements you should consider:
- Risks: We feel that you should assess the 2 warning signs for Vesuvius (1 can't be ignored!) we've flagged before making an investment in the company.
- Future Earnings: How does VSVS's growth rate compare to its peers and the wider market? Dig deeper into the analyst consensus number for the upcoming years by interacting with our free analyst growth expectation chart.
- Other Solid Businesses: Low debt, high returns on equity and good past performance are fundamental to a strong business. Why not explore our interactive list of stocks with solid business fundamentals to see if there are other companies you may not have considered!
PS. Simply Wall St updates its DCF calculation for every British stock every day, so if you want to find the intrinsic value of any other stock just search here.
New: Manage All Your Stock Portfolios in One Place
We've created the ultimate portfolio companion for stock investors, and it's free.
• Connect an unlimited number of Portfolios and see your total in one currency
• Be alerted to new Warning Signs or Risks via email or mobile
• Track the Fair Value of your stocks
Have feedback on this article? Concerned about the content? Get in touch with us directly. Alternatively, email editorial-team (at) simplywallst.com.
This article by Simply Wall St is general in nature. We provide commentary based on historical data and analyst forecasts only using an unbiased methodology and our articles are not intended to be financial advice. It does not constitute a recommendation to buy or sell any stock, and does not take account of your objectives, or your financial situation. We aim to bring you long-term focused analysis driven by fundamental data. Note that our analysis may not factor in the latest price-sensitive company announcements or qualitative material. Simply Wall St has no position in any stocks mentioned.
About LSE:VSVS
Vesuvius
Provides molten metal flow engineering and technology services to steel and foundry casting industries worldwide.
Flawless balance sheet, undervalued and pays a dividend.
Similar Companies
Market Insights


Advertisement
Community Narratives
A Quality Compounder Marked Down on Overblown Fears
Fair Value US$120.72|62.4% undervalued
BA
Community Contributor

Wyndham Continues Global Expansion with 19% Ancillary Revenue Growth
Fair Value US$105.80|19.2% undervalued
ZW
Community Contributor