
Advertisement
- United Kingdom
- /
- Construction
- /
- LSE:SMJ
Did J. Smart (Contractors)'s (LON:SMJ) Share Price Deserve to Gain 14%?

When we invest, we're generally looking for stocks that outperform the market average. Buying under-rated businesses is one path to excess returns. For example, long term J. Smart & Co. (Contractors) PLC (LON:SMJ) shareholders have enjoyed a 14% share price rise over the last half decade, well in excess of the market return of around 5.9% (not including dividends). However, more recent returns haven't been as impressive as that, with the stock returning just 6.7% in the last year, including dividends.
View our latest analysis for J. Smart (Contractors)
While markets are a powerful pricing mechanism, share prices reflect investor sentiment, not just underlying business performance. By comparing earnings per share (EPS) and share price changes over time, we can get a feel for how investor attitudes to a company have morphed over time.
Over half a decade, J. Smart (Contractors) managed to grow its earnings per share at 104% a year. The EPS growth is more impressive than the yearly share price gain of 2.7% over the same period. So it seems the market isn't so enthusiastic about the stock these days. This cautious sentiment is reflected in its (fairly low) P/E ratio of 10.32.
The company's earnings per share (over time) is depicted in the image below (click to see the exact numbers).
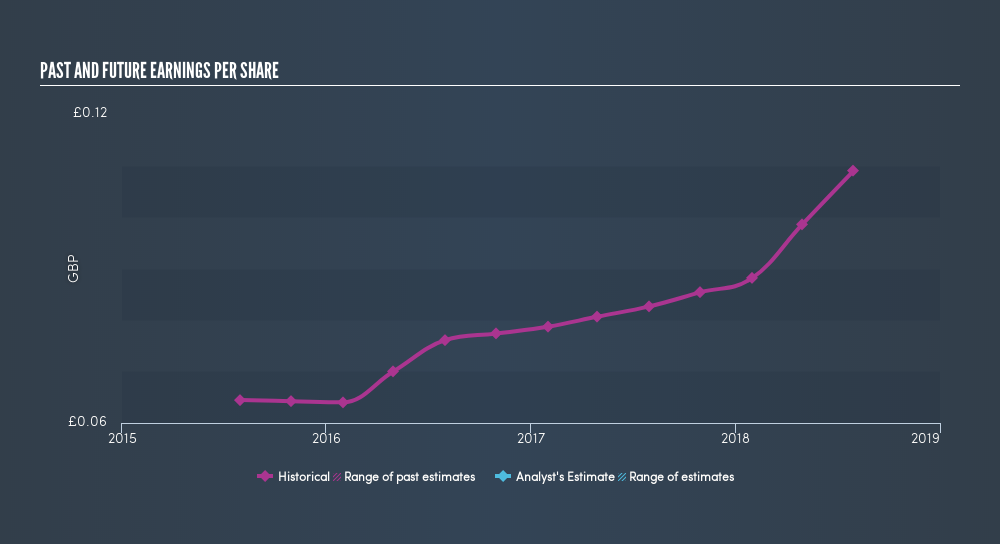
It might be well worthwhile taking a look at our freereport on J. Smart (Contractors)'s earnings, revenue and cash flow.
What About Dividends?
It is important to consider the total shareholder return, as well as the share price return, for any given stock. The TSR is a return calculation that accounts for the value of cash dividends (assuming that any dividend received was reinvested) and the calculated value of any discounted capital raisings and spin-offs. So for companies that pay a generous dividend, the TSR is often a lot higher than the share price return. As it happens, J. Smart (Contractors)'s TSR for the last 5 years was 32%, which exceeds the share price return mentioned earlier. And there's no prize for guessing that the dividend payments largely explain the divergence!
A Different Perspective
J. Smart (Contractors) shareholders have received returns of 6.7% over twelve months (even including dividends), which isn't far from the general market return. Most would be happy with a gain, and it helps that the year's return is actually better than the average return over five years, which was 5.8%. It is possible that management foresight will bring growth well into the future, even if the share price slows down. Is J. Smart (Contractors) cheap compared to other companies? These 3 valuation measures might help you decide.
Of course, you might find a fantastic investment by looking elsewhere. So take a peek at this freelist of companies we expect will grow earnings.
Please note, the market returns quoted in this article reflect the market weighted average returns of stocks that currently trade on GB exchanges.We aim to bring you long-term focused research analysis driven by fundamental data. Note that our analysis may not factor in the latest price-sensitive company announcements or qualitative material.
If you spot an error that warrants correction, please contact the editor at editorial-team@simplywallst.com. This article by Simply Wall St is general in nature. It does not constitute a recommendation to buy or sell any stock, and does not take account of your objectives, or your financial situation. Simply Wall St has no position in the stocks mentioned. Thank you for reading.
About LSE:SMJ
J. Smart (Contractors)
Engages in the contracting, developing, and constructing public works, shopping centers, offices, factories, warehouses, local authority, and landlords and private housing projects in the United Kingdom.
Excellent balance sheet average dividend payer.
Market Insights


Advertisement
Community Narratives
The Future of Drug Testing? Fingerprint Tech Shows Serious Promise
Fair Value US$2.98|40.3% undervalued
JO
Community Contributor
Suncorp’s Next Chapter: Insurance-Only and Ready to Grow
Fair Value AU$22.83|7.6% undervalued
RO
Community Contributor
Thyssenkrupp Nucera Will Achieve Double-Digit Profits by 2030 Boosted by Hydrogen Growth
Fair Value €14.40|30.6% undervalued
CH
Community Contributor
Tesla’s Nvidia Moment – The AI & Robotics Inflection Point
Fair Value US$359.72|12.3% undervalued
BL
Community Contributor