- United Kingdom
- /
- Industrials
- /
- LSE:SMIN
Despite the downward trend in earnings at Smiths Group (LON:SMIN) the stock advances 3.3%, bringing three-year gains to 65%


By buying an index fund, you can roughly match the market return with ease. But if you buy good businesses at attractive prices, your portfolio returns could exceed the average market return. Just take a look at Smiths Group plc (LON:SMIN), which is up 53%, over three years, soundly beating the market return of 27% (not including dividends). However, more recent returns haven't been as impressive as that, with the stock returning just 15% in the last year , including dividends .
After a strong gain in the past week, it's worth seeing if longer term returns have been driven by improving fundamentals.
View our latest analysis for Smiths Group
In his essay The Superinvestors of Graham-and-Doddsville Warren Buffett described how share prices do not always rationally reflect the value of a business. By comparing earnings per share (EPS) and share price changes over time, we can get a feel for how investor attitudes to a company have morphed over time.
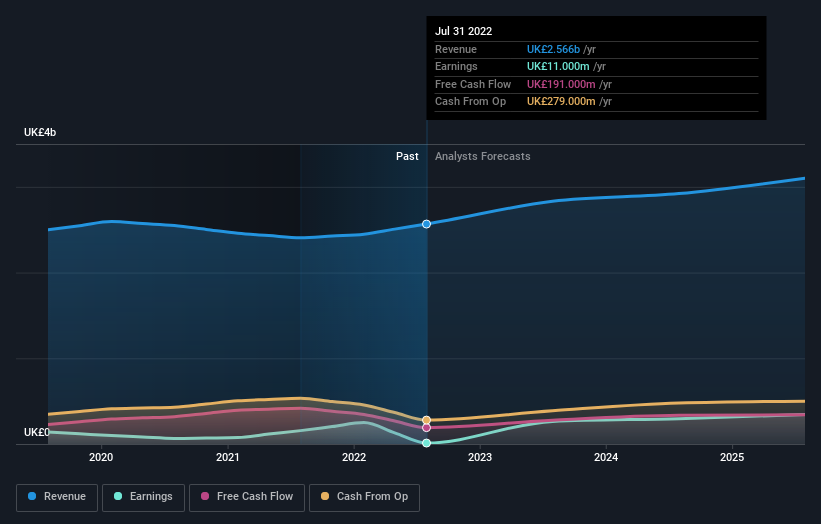
During the three years of share price growth, Smiths Group actually saw its earnings per share (EPS) drop 55% per year.
This means it's unlikely the market is judging the company based on earnings growth. Therefore, we think it's worth considering other metrics as well.
The revenue drop of 1.0% is as underwhelming as some politicians. What's clear is that historic earnings and revenue aren't matching up with the share price action, very well. So you might have to dig deeper to get a grasp of the situation
You can see how earnings and revenue have changed over time in the image below (click on the chart to see the exact values).
Smiths Group is well known by investors, and plenty of clever analysts have tried to predict the future profit levels. You can see what analysts are predicting for Smiths Group in this interactive graph of future profit estimates.
What About Dividends?
As well as measuring the share price return, investors should also consider the total shareholder return (TSR). Whereas the share price return only reflects the change in the share price, the TSR includes the value of dividends (assuming they were reinvested) and the benefit of any discounted capital raising or spin-off. So for companies that pay a generous dividend, the TSR is often a lot higher than the share price return. As it happens, Smiths Group's TSR for the last 3 years was 65%, which exceeds the share price return mentioned earlier. This is largely a result of its dividend payments!
A Different Perspective
It's good to see that Smiths Group has rewarded shareholders with a total shareholder return of 15% in the last twelve months. Of course, that includes the dividend. Since the one-year TSR is better than the five-year TSR (the latter coming in at 5% per year), it would seem that the stock's performance has improved in recent times. Given the share price momentum remains strong, it might be worth taking a closer look at the stock, lest you miss an opportunity. It's always interesting to track share price performance over the longer term. But to understand Smiths Group better, we need to consider many other factors. Consider risks, for instance. Every company has them, and we've spotted 3 warning signs for Smiths Group you should know about.
Of course Smiths Group may not be the best stock to buy. So you may wish to see this free collection of growth stocks.
Please note, the market returns quoted in this article reflect the market weighted average returns of stocks that currently trade on British exchanges.
If you're looking to trade Smiths Group, open an account with the lowest-cost platform trusted by professionals, Interactive Brokers.
With clients in over 200 countries and territories, and access to 160 markets, IBKR lets you trade stocks, options, futures, forex, bonds and funds from a single integrated account.
Enjoy no hidden fees, no account minimums, and FX conversion rates as low as 0.03%, far better than what most brokers offer.
Sponsored ContentNew: Manage All Your Stock Portfolios in One Place
We've created the ultimate portfolio companion for stock investors, and it's free.
• Connect an unlimited number of Portfolios and see your total in one currency
• Be alerted to new Warning Signs or Risks via email or mobile
• Track the Fair Value of your stocks
Have feedback on this article? Concerned about the content? Get in touch with us directly. Alternatively, email editorial-team (at) simplywallst.com.
This article by Simply Wall St is general in nature. We provide commentary based on historical data and analyst forecasts only using an unbiased methodology and our articles are not intended to be financial advice. It does not constitute a recommendation to buy or sell any stock, and does not take account of your objectives, or your financial situation. We aim to bring you long-term focused analysis driven by fundamental data. Note that our analysis may not factor in the latest price-sensitive company announcements or qualitative material. Simply Wall St has no position in any stocks mentioned.
About LSE:SMIN
Smiths Group
Operates as an industrial technology company in Americas, Europe, the Asia Pacific, and internationally.
Flawless balance sheet with solid track record.
Similar Companies
Market Insights

Community Narratives

