- United Kingdom
- /
- Aerospace & Defense
- /
- LSE:QQ.
The Returns At QinetiQ Group (LON:QQ.) Provide Us With Signs Of What's To Come


Did you know there are some financial metrics that can provide clues of a potential multi-bagger? In a perfect world, we'd like to see a company investing more capital into its business and ideally the returns earned from that capital are also increasing. Ultimately, this demonstrates that it's a business that is reinvesting profits at increasing rates of return. Although, when we looked at QinetiQ Group (LON:QQ.), it didn't seem to tick all of these boxes.
Understanding Return On Capital Employed (ROCE)
If you haven't worked with ROCE before, it measures the 'return' (pre-tax profit) a company generates from capital employed in its business. To calculate this metric for QinetiQ Group, this is the formula:
Return on Capital Employed = Earnings Before Interest and Tax (EBIT) ÷ (Total Assets - Current Liabilities)
0.12 = UK£131m ÷ (UK£1.5b - UK£396m) (Based on the trailing twelve months to September 2020).
So, QinetiQ Group has an ROCE of 12%. That's a relatively normal return on capital, and it's around the 11% generated by the Aerospace & Defense industry.
View our latest analysis for QinetiQ Group
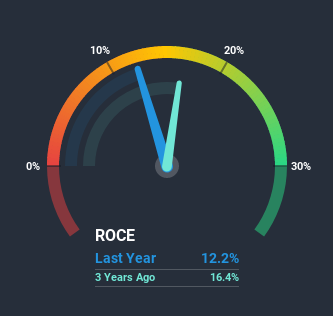
Above you can see how the current ROCE for QinetiQ Group compares to its prior returns on capital, but there's only so much you can tell from the past. If you'd like, you can check out the forecasts from the analysts covering QinetiQ Group here for free.
What Can We Tell From QinetiQ Group's ROCE Trend?
In terms of QinetiQ Group's historical ROCE movements, the trend isn't fantastic. To be more specific, ROCE has fallen from 33% over the last five years. However, given capital employed and revenue have both increased it appears that the business is currently pursuing growth, at the consequence of short term returns. And if the increased capital generates additional returns, the business, and thus shareholders, will benefit in the long run.
On a side note, QinetiQ Group has done well to pay down its current liabilities to 27% of total assets. That could partly explain why the ROCE has dropped. Effectively this means their suppliers or short-term creditors are funding less of the business, which reduces some elements of risk. Some would claim this reduces the business' efficiency at generating ROCE since it is now funding more of the operations with its own money.
In Conclusion...
While returns have fallen for QinetiQ Group in recent times, we're encouraged to see that sales are growing and that the business is reinvesting in its operations. And the stock has followed suit returning a meaningful 54% to shareholders over the last five years. So should these growth trends continue, we'd be optimistic on the stock going forward.
If you want to continue researching QinetiQ Group, you might be interested to know about the 1 warning sign that our analysis has discovered.
While QinetiQ Group may not currently earn the highest returns, we've compiled a list of companies that currently earn more than 25% return on equity. Check out this free list here.
When trading QinetiQ Group or any other investment, use the platform considered by many to be the Professional's Gateway to the Worlds Market, Interactive Brokers. You get the lowest-cost* trading on stocks, options, futures, forex, bonds and funds worldwide from a single integrated account. Promoted
If you're looking to trade QinetiQ Group, open an account with the lowest-cost platform trusted by professionals, Interactive Brokers.
With clients in over 200 countries and territories, and access to 160 markets, IBKR lets you trade stocks, options, futures, forex, bonds and funds from a single integrated account.
Enjoy no hidden fees, no account minimums, and FX conversion rates as low as 0.03%, far better than what most brokers offer.
Sponsored ContentValuation is complex, but we're here to simplify it.
Discover if QinetiQ Group might be undervalued or overvalued with our detailed analysis, featuring fair value estimates, potential risks, dividends, insider trades, and its financial condition.
Access Free AnalysisThis article by Simply Wall St is general in nature. It does not constitute a recommendation to buy or sell any stock, and does not take account of your objectives, or your financial situation. We aim to bring you long-term focused analysis driven by fundamental data. Note that our analysis may not factor in the latest price-sensitive company announcements or qualitative material. Simply Wall St has no position in any stocks mentioned.
*Interactive Brokers Rated Lowest Cost Broker by StockBrokers.com Annual Online Review 2020
Have feedback on this article? Concerned about the content? Get in touch with us directly. Alternatively, email editorial-team (at) simplywallst.com.
About LSE:QQ.
QinetiQ Group
Operates as a science and engineering company in the defense, security, and infrastructure markets in the United Kingdom, the United States, Australia, and internationally.
Undervalued with high growth potential and pays a dividend.
Similar Companies
Market Insights

Community Narratives

