- United Kingdom
- /
- Aerospace & Defense
- /
- LSE:QQ.
Shareholders Will Most Likely Find QinetiQ Group plc's (LON:QQ.) CEO Compensation Acceptable


CEO Steve Wadey has done a decent job of delivering relatively good performance at QinetiQ Group plc (LON:QQ.) recently. This is something shareholders will keep in mind as they cast their votes on company resolutions such as executive remuneration in the upcoming AGM on 21 July 2021. Based on our analysis of the data below, we think CEO compensation seems reasonable for now.
Check out our latest analysis for QinetiQ Group
Comparing QinetiQ Group plc's CEO Compensation With the industry
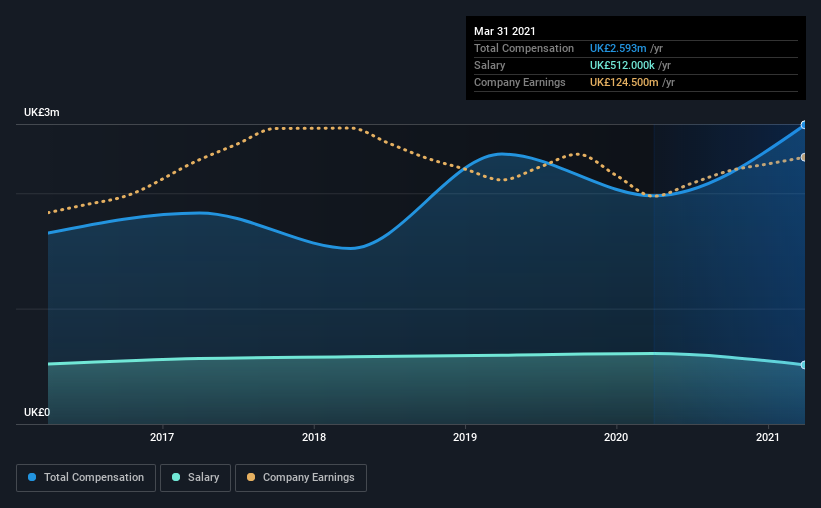
At the time of writing, our data shows that QinetiQ Group plc has a market capitalization of UK£2.0b, and reported total annual CEO compensation of UK£2.6m for the year to March 2021. We note that's an increase of 31% above last year. While this analysis focuses on total compensation, it's worth acknowledging that the salary portion is lower, valued at UK£512k.
On comparing similar companies from the same industry with market caps ranging from UK£1.4b to UK£4.6b, we found that the median CEO total compensation was UK£3.4m. From this we gather that Steve Wadey is paid around the median for CEOs in the industry. Moreover, Steve Wadey also holds UK£2.3m worth of QinetiQ Group stock directly under their own name, which reveals to us that they have a significant personal stake in the company.
| Component | 2021 | 2020 | Proportion (2021) |
| Salary | UK£512k | UK£610k | 20% |
| Other | UK£2.1m | UK£1.4m | 80% |
| Total Compensation | UK£2.6m | UK£2.0m | 100% |
Talking in terms of the industry, salary represented approximately 48% of total compensation out of all the companies we analyzed, while other remuneration made up 52% of the pie. It's interesting to note that QinetiQ Group allocates a smaller portion of compensation to salary in comparison to the broader industry. If total compensation is slanted towards non-salary benefits, it indicates that CEO pay is linked to company performance.
A Look at QinetiQ Group plc's Growth Numbers
Over the last three years, QinetiQ Group plc has shrunk its earnings per share by 3.7% per year. It achieved revenue growth of 19% over the last year.
The decrease in EPS could be a concern for some investors. But on the other hand, revenue growth is strong, suggesting a brighter future. In conclusion we can't form a strong opinion about business performance yet; but it's one worth watching. Looking ahead, you might want to check this free visual report on analyst forecasts for the company's future earnings..
Has QinetiQ Group plc Been A Good Investment?
We think that the total shareholder return of 36%, over three years, would leave most QinetiQ Group plc shareholders smiling. So they may not be at all concerned if the CEO were to be paid more than is normal for companies around the same size.
To Conclude...
Although the company has performed relatively well, we still think there are some areas that could be improved. We reckon that there are some shareholders who may be hesitant to increase CEO pay further until EPS growth starts to improve, despite the robust revenue growth.
While CEO pay is an important factor to be aware of, there are other areas that investors should be mindful of as well. That's why we did some digging and identified 2 warning signs for QinetiQ Group that investors should think about before committing capital to this stock.
Of course, you might find a fantastic investment by looking at a different set of stocks. So take a peek at this free list of interesting companies.
If you decide to trade QinetiQ Group, use the lowest-cost* platform that is rated #1 Overall by Barron’s, Interactive Brokers. Trade stocks, options, futures, forex, bonds and funds on 135 markets, all from a single integrated account. Promoted
Valuation is complex, but we're here to simplify it.
Discover if QinetiQ Group might be undervalued or overvalued with our detailed analysis, featuring fair value estimates, potential risks, dividends, insider trades, and its financial condition.
Access Free AnalysisThis article by Simply Wall St is general in nature. It does not constitute a recommendation to buy or sell any stock, and does not take account of your objectives, or your financial situation. We aim to bring you long-term focused analysis driven by fundamental data. Note that our analysis may not factor in the latest price-sensitive company announcements or qualitative material. Simply Wall St has no position in any stocks mentioned.
*Interactive Brokers Rated Lowest Cost Broker by StockBrokers.com Annual Online Review 2020
Have feedback on this article? Concerned about the content? Get in touch with us directly. Alternatively, email editorial-team (at) simplywallst.com.
About LSE:QQ.
QinetiQ Group
Operates as a science and engineering company in the defense, security, and infrastructure markets in the United Kingdom, the United States, Australia, and internationally.
Undervalued with high growth potential and pays a dividend.
Similar Companies
Market Insights

Community Narratives

