
Advertisement
- United Kingdom
- /
- Construction
- /
- LSE:KIE
Kier Group plc (LON:KIE) Stock Rockets 29% But Many Are Still Ignoring The Company

Kier Group plc (LON:KIE) shareholders would be excited to see that the share price has had a great month, posting a 29% gain and recovering from prior weakness. Taking a wider view, although not as strong as the last month, the full year gain of 11% is also fairly reasonable.
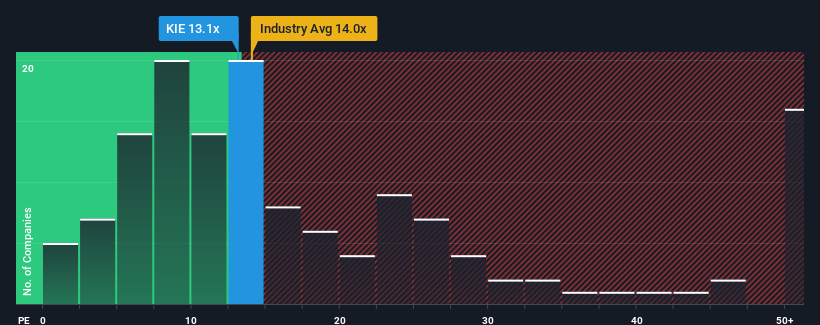
Although its price has surged higher, Kier Group's price-to-earnings (or "P/E") ratio of 13.1x might still make it look like a buy right now compared to the market in the United Kingdom, where around half of the companies have P/E ratios above 16x and even P/E's above 28x are quite common. Nonetheless, we'd need to dig a little deeper to determine if there is a rational basis for the reduced P/E.
We've discovered 1 warning sign about Kier Group. View them for free.Recent times have been advantageous for Kier Group as its earnings have been rising faster than most other companies. One possibility is that the P/E is low because investors think this strong earnings performance might be less impressive moving forward. If not, then existing shareholders have reason to be quite optimistic about the future direction of the share price.
See our latest analysis for Kier Group
How Is Kier Group's Growth Trending?
There's an inherent assumption that a company should underperform the market for P/E ratios like Kier Group's to be considered reasonable.
Taking a look back first, we see that the company grew earnings per share by an impressive 26% last year. The latest three year period has also seen an excellent 46% overall rise in EPS, aided by its short-term performance. Therefore, it's fair to say the earnings growth recently has been superb for the company.
Turning to the outlook, the next three years should generate growth of 19% per year as estimated by the five analysts watching the company. That's shaping up to be materially higher than the 16% per annum growth forecast for the broader market.
With this information, we find it odd that Kier Group is trading at a P/E lower than the market. It looks like most investors are not convinced at all that the company can achieve future growth expectations.
The Key Takeaway
Despite Kier Group's shares building up a head of steam, its P/E still lags most other companies. Typically, we'd caution against reading too much into price-to-earnings ratios when settling on investment decisions, though it can reveal plenty about what other market participants think about the company.
Our examination of Kier Group's analyst forecasts revealed that its superior earnings outlook isn't contributing to its P/E anywhere near as much as we would have predicted. There could be some major unobserved threats to earnings preventing the P/E ratio from matching the positive outlook. It appears many are indeed anticipating earnings instability, because these conditions should normally provide a boost to the share price.
Before you take the next step, you should know about the 1 warning sign for Kier Group that we have uncovered.
It's important to make sure you look for a great company, not just the first idea you come across. So take a peek at this free list of interesting companies with strong recent earnings growth (and a low P/E).
Valuation is complex, but we're here to simplify it.
Discover if Kier Group might be undervalued or overvalued with our detailed analysis, featuring fair value estimates, potential risks, dividends, insider trades, and its financial condition.
Access Free AnalysisHave feedback on this article? Concerned about the content? Get in touch with us directly. Alternatively, email editorial-team (at) simplywallst.com.
This article by Simply Wall St is general in nature. We provide commentary based on historical data and analyst forecasts only using an unbiased methodology and our articles are not intended to be financial advice. It does not constitute a recommendation to buy or sell any stock, and does not take account of your objectives, or your financial situation. We aim to bring you long-term focused analysis driven by fundamental data. Note that our analysis may not factor in the latest price-sensitive company announcements or qualitative material. Simply Wall St has no position in any stocks mentioned.
About LSE:KIE
Kier Group
Primarily engages in the construction business in the United Kingdom and internationally.
Proven track record and fair value.
Similar Companies
Market Insights

Advertisement
Community Narratives
Pinterest will surge as advertising innovations ignite revenue growth
Fair Value US$42.63|27.1% undervalued
BR
Community Contributor
Brambles' Revenue Set to Climb 14% with Profit Margins Following
Fair Value AU$21.90|4.9% overvalued
RO
Community Contributor
Challenging Future for STG as Organic Sales Decline by 8.8%
Fair Value DKK 116.13|26.8% undervalued
KA
Community Contributor