
Advertisement
- United Kingdom
- /
- Machinery
- /
- LSE:IMI
These 4 Measures Indicate That IMI (LON:IMI) Is Using Debt Reasonably Well
Some say volatility, rather than debt, is the best way to think about risk as an investor, but Warren Buffett famously said that 'Volatility is far from synonymous with risk.' So it might be obvious that you need to consider debt, when you think about how risky any given stock is, because too much debt can sink a company. As with many other companies IMI plc (LON:IMI) makes use of debt. But the real question is whether this debt is making the company risky.
When Is Debt Dangerous?
Debt and other liabilities become risky for a business when it cannot easily fulfill those obligations, either with free cash flow or by raising capital at an attractive price. Ultimately, if the company can't fulfill its legal obligations to repay debt, shareholders could walk away with nothing. However, a more frequent (but still costly) occurrence is where a company must issue shares at bargain-basement prices, permanently diluting shareholders, just to shore up its balance sheet. By replacing dilution, though, debt can be an extremely good tool for businesses that need capital to invest in growth at high rates of return. The first step when considering a company's debt levels is to consider its cash and debt together.
Check out our latest analysis for IMI
What Is IMI's Debt?
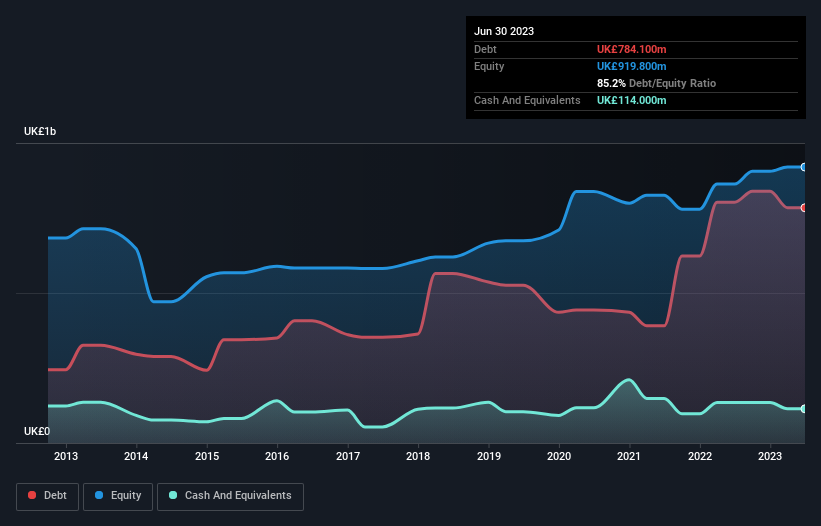
As you can see below, IMI had UK£784.1m of debt, at June 2023, which is about the same as the year before. You can click the chart for greater detail. However, it does have UK£114.0m in cash offsetting this, leading to net debt of about UK£670.1m.
How Healthy Is IMI's Balance Sheet?
The latest balance sheet data shows that IMI had liabilities of UK£816.6m due within a year, and liabilities of UK£752.4m falling due after that. On the other hand, it had cash of UK£114.0m and UK£509.4m worth of receivables due within a year. So its liabilities total UK£945.6m more than the combination of its cash and short-term receivables.
This deficit isn't so bad because IMI is worth UK£3.93b, and thus could probably raise enough capital to shore up its balance sheet, if the need arose. But it's clear that we should definitely closely examine whether it can manage its debt without dilution.
We use two main ratios to inform us about debt levels relative to earnings. The first is net debt divided by earnings before interest, tax, depreciation, and amortization (EBITDA), while the second is how many times its earnings before interest and tax (EBIT) covers its interest expense (or its interest cover, for short). Thus we consider debt relative to earnings both with and without depreciation and amortization expenses.
We'd say that IMI's moderate net debt to EBITDA ratio ( being 1.5), indicates prudence when it comes to debt. And its strong interest cover of 14.8 times, makes us even more comfortable. Also positive, IMI grew its EBIT by 21% in the last year, and that should make it easier to pay down debt, going forward. There's no doubt that we learn most about debt from the balance sheet. But it is future earnings, more than anything, that will determine IMI's ability to maintain a healthy balance sheet going forward. So if you want to see what the professionals think, you might find this free report on analyst profit forecasts to be interesting.
Finally, a company can only pay off debt with cold hard cash, not accounting profits. So we always check how much of that EBIT is translated into free cash flow. During the last three years, IMI produced sturdy free cash flow equating to 76% of its EBIT, about what we'd expect. This free cash flow puts the company in a good position to pay down debt, when appropriate.
Our View
IMI's interest cover suggests it can handle its debt as easily as Cristiano Ronaldo could score a goal against an under 14's goalkeeper. And that's just the beginning of the good news since its conversion of EBIT to free cash flow is also very heartening. Looking at the bigger picture, we think IMI's use of debt seems quite reasonable and we're not concerned about it. While debt does bring risk, when used wisely it can also bring a higher return on equity. The balance sheet is clearly the area to focus on when you are analysing debt. However, not all investment risk resides within the balance sheet - far from it. For instance, we've identified 1 warning sign for IMI that you should be aware of.
At the end of the day, it's often better to focus on companies that are free from net debt. You can access our special list of such companies (all with a track record of profit growth). It's free.
New: AI Stock Screener & Alerts
Our new AI Stock Screener scans the market every day to uncover opportunities.
• Dividend Powerhouses (3%+ Yield)
• Undervalued Small Caps with Insider Buying
• High growth Tech and AI Companies
Or build your own from over 50 metrics.
Have feedback on this article? Concerned about the content? Get in touch with us directly. Alternatively, email editorial-team (at) simplywallst.com.
This article by Simply Wall St is general in nature. We provide commentary based on historical data and analyst forecasts only using an unbiased methodology and our articles are not intended to be financial advice. It does not constitute a recommendation to buy or sell any stock, and does not take account of your objectives, or your financial situation. We aim to bring you long-term focused analysis driven by fundamental data. Note that our analysis may not factor in the latest price-sensitive company announcements or qualitative material. Simply Wall St has no position in any stocks mentioned.
About LSE:IMI
IMI
An engineering company, designs, manufactures, and services engineering products in the United Kingdom, Germany, rest of Europe, the United States, rest of the Americas, China, rest of the Asia Pacific, the Middle East, and Africa.
Adequate balance sheet with moderate growth potential.
Similar Companies
Market Insights

Advertisement
Community Narratives
Finding The True Value Of A Logistics Powerhouse
Fair Value US$95.21|8.4% undervalued
NV
Community Contributor
Paradigm Biopharmaceuticals Will Lead Osteoarthritis Treatment with Zilosul's FDA Success
Fair Value AU$5.50|92.1% undervalued
AM
Community Contributor
Barrick Mining (ABX:CA): A Gold Hedge against a U.S. Shutdown
Fair Value CA$60.00|24.2% undervalued
GM
Community Contributor