Stock Analysis
- United Kingdom
- /
- Trade Distributors
- /
- LSE:HWDN
Howden Joinery Group's (LON:HWDN) Earnings Are Weaker Than They Seem


Howden Joinery Group Plc's (LON:HWDN) robust earnings report didn't manage to move the market for its stock. Our analysis suggests that this might be because shareholders have noticed some concerning underlying factors.
View our latest analysis for Howden Joinery Group
Examining Cashflow Against Howden Joinery Group's Earnings
Many investors haven't heard of the accrual ratio from cashflow, but it is actually a useful measure of how well a company's profit is backed up by free cash flow (FCF) during a given period. To get the accrual ratio we first subtract FCF from profit for a period, and then divide that number by the average operating assets for the period. The ratio shows us how much a company's profit exceeds its FCF.
As a result, a negative accrual ratio is a positive for the company, and a positive accrual ratio is a negative. While it's not a problem to have a positive accrual ratio, indicating a certain level of non-cash profits, a high accrual ratio is arguably a bad thing, because it indicates paper profits are not matched by cash flow. That's because some academic studies have suggested that high accruals ratios tend to lead to lower profit or less profit growth.
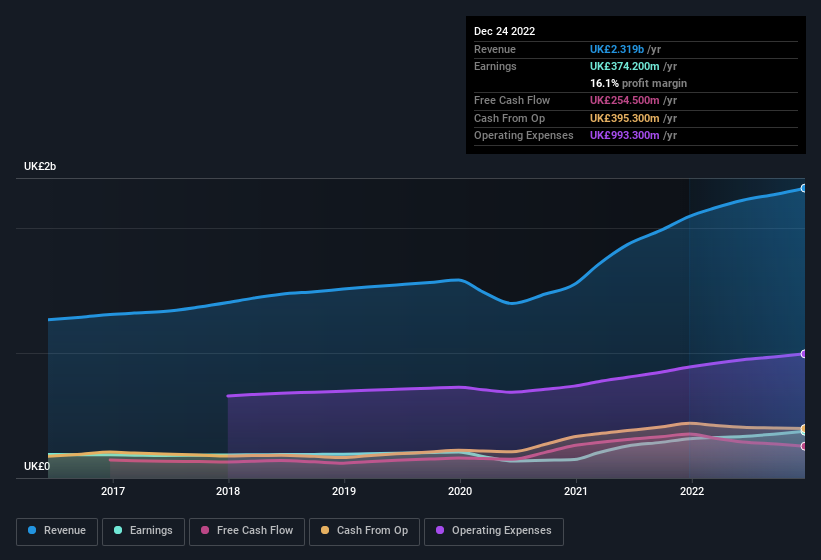
Howden Joinery Group has an accrual ratio of 0.23 for the year to December 2022. We can therefore deduce that its free cash flow fell well short of covering its statutory profit. In fact, it had free cash flow of UK£255m in the last year, which was a lot less than its statutory profit of UK£374.2m. Howden Joinery Group's free cash flow actually declined over the last year, but it may bounce back next year, since free cash flow is often more volatile than accounting profits. The good news for shareholders is that Howden Joinery Group's accrual ratio was much better last year, so this year's poor reading might simply be a case of a short term mismatch between profit and FCF. As a result, some shareholders may be looking for stronger cash conversion in the current year.
That might leave you wondering what analysts are forecasting in terms of future profitability. Luckily, you can click here to see an interactive graph depicting future profitability, based on their estimates.
Our Take On Howden Joinery Group's Profit Performance
Howden Joinery Group's accrual ratio for the last twelve months signifies cash conversion is less than ideal, which is a negative when it comes to our view of its earnings. Therefore, it seems possible to us that Howden Joinery Group's true underlying earnings power is actually less than its statutory profit. But on the bright side, its earnings per share have grown at an extremely impressive rate over the last three years. The goal of this article has been to assess how well we can rely on the statutory earnings to reflect the company's potential, but there is plenty more to consider. So if you'd like to dive deeper into this stock, it's crucial to consider any risks it's facing. For instance, we've identified 2 warning signs for Howden Joinery Group (1 is significant) you should be familiar with.
Today we've zoomed in on a single data point to better understand the nature of Howden Joinery Group's profit. But there is always more to discover if you are capable of focussing your mind on minutiae. For example, many people consider a high return on equity as an indication of favorable business economics, while others like to 'follow the money' and search out stocks that insiders are buying. While it might take a little research on your behalf, you may find this free collection of companies boasting high return on equity, or this list of stocks that insiders are buying to be useful.
Valuation is complex, but we're helping make it simple.
Find out whether Howden Joinery Group is potentially over or undervalued by checking out our comprehensive analysis, which includes fair value estimates, risks and warnings, dividends, insider transactions and financial health.
View the Free AnalysisHave feedback on this article? Concerned about the content? Get in touch with us directly. Alternatively, email editorial-team (at) simplywallst.com.
This article by Simply Wall St is general in nature. We provide commentary based on historical data and analyst forecasts only using an unbiased methodology and our articles are not intended to be financial advice. It does not constitute a recommendation to buy or sell any stock, and does not take account of your objectives, or your financial situation. We aim to bring you long-term focused analysis driven by fundamental data. Note that our analysis may not factor in the latest price-sensitive company announcements or qualitative material. Simply Wall St has no position in any stocks mentioned.
About LSE:HWDN
Howden Joinery Group
Supplies various kitchen, joinery, and hardware products in the United Kingdom, France, Belgium, and the Republic of Ireland.
Flawless balance sheet average dividend payer.
