Stock Analysis
- United Kingdom
- /
- Trade Distributors
- /
- LSE:GFTU
Is Grafton Group plc's (LON:GFTU) Recent Stock Performance Influenced By Its Fundamentals In Any Way?


Grafton Group (LON:GFTU) has had a great run on the share market with its stock up by a significant 23% over the last three months. As most would know, fundamentals are what usually guide market price movements over the long-term, so we decided to look at the company's key financial indicators today to determine if they have any role to play in the recent price movement. Specifically, we decided to study Grafton Group's ROE in this article.
ROE or return on equity is a useful tool to assess how effectively a company can generate returns on the investment it received from its shareholders. In other words, it is a profitability ratio which measures the rate of return on the capital provided by the company's shareholders.
Check out our latest analysis for Grafton Group
How Do You Calculate Return On Equity?
Return on equity can be calculated by using the formula:
Return on Equity = Net Profit (from continuing operations) ÷ Shareholders' Equity
So, based on the above formula, the ROE for Grafton Group is:
10% = UK£174m ÷ UK£1.7b (Based on the trailing twelve months to June 2023).
The 'return' is the amount earned after tax over the last twelve months. That means that for every £1 worth of shareholders' equity, the company generated £0.10 in profit.
Why Is ROE Important For Earnings Growth?
So far, we've learned that ROE is a measure of a company's profitability. Depending on how much of these profits the company reinvests or "retains", and how effectively it does so, we are then able to assess a company’s earnings growth potential. Assuming all else is equal, companies that have both a higher return on equity and higher profit retention are usually the ones that have a higher growth rate when compared to companies that don't have the same features.
Grafton Group's Earnings Growth And 10% ROE
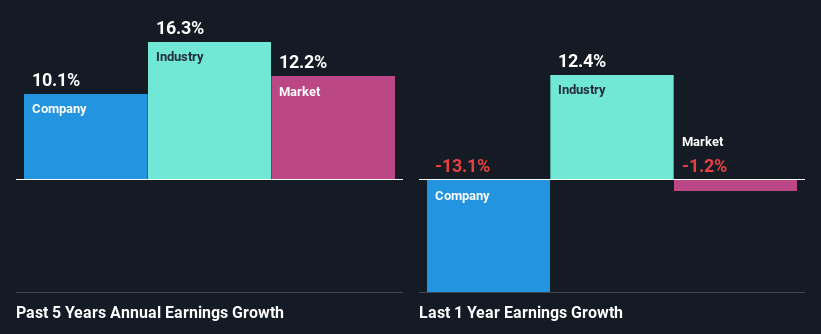
At first glance, Grafton Group seems to have a decent ROE. Be that as it may, the company's ROE is still quite lower than the industry average of 15%. However, the moderate 10% net income growth seen by Grafton Group over the past five years is definitely a positive. So, there might be other aspects that are positively influencing earnings growth. For instance, the company has a low payout ratio or is being managed efficiently. Bear in mind, the company does have a respectable level of ROE. It is just that the industry ROE is higher. So this also provides some context to the earnings growth seen by the company.
As a next step, we compared Grafton Group's net income growth with the industry and were disappointed to see that the company's growth is lower than the industry average growth of 16% in the same period.
The basis for attaching value to a company is, to a great extent, tied to its earnings growth. It’s important for an investor to know whether the market has priced in the company's expected earnings growth (or decline). By doing so, they will have an idea if the stock is headed into clear blue waters or if swampy waters await. Is Grafton Group fairly valued compared to other companies? These 3 valuation measures might help you decide.
Is Grafton Group Using Its Retained Earnings Effectively?
Grafton Group has a three-year median payout ratio of 36%, which implies that it retains the remaining 64% of its profits. This suggests that its dividend is well covered, and given the decent growth seen by the company, it looks like management is reinvesting its earnings efficiently.
Moreover, Grafton Group is determined to keep sharing its profits with shareholders which we infer from its long history of paying a dividend for at least ten years. Our latest analyst data shows that the future payout ratio of the company is expected to rise to 52% over the next three years. Accordingly, the expected increase in the payout ratio explains the expected decline in the company's ROE to 7.6%, over the same period.
Conclusion
In total, it does look like Grafton Group has some positive aspects to its business. Particularly, its earnings have grown respectably as we saw earlier, which was likely achieved due to the company reinvesting most of its earnings at a decent rate of return, to grow its business. Having said that, on studying current analyst estimates, we were concerned to see that while the company has grown its earnings in the past, analysts expect its earnings to shrink in the future. Are these analysts expectations based on the broad expectations for the industry, or on the company's fundamentals? Click here to be taken to our analyst's forecasts page for the company.
Valuation is complex, but we're helping make it simple.
Find out whether Grafton Group is potentially over or undervalued by checking out our comprehensive analysis, which includes fair value estimates, risks and warnings, dividends, insider transactions and financial health.
View the Free AnalysisHave feedback on this article? Concerned about the content? Get in touch with us directly. Alternatively, email editorial-team (at) simplywallst.com.
This article by Simply Wall St is general in nature. We provide commentary based on historical data and analyst forecasts only using an unbiased methodology and our articles are not intended to be financial advice. It does not constitute a recommendation to buy or sell any stock, and does not take account of your objectives, or your financial situation. We aim to bring you long-term focused analysis driven by fundamental data. Note that our analysis may not factor in the latest price-sensitive company announcements or qualitative material. Simply Wall St has no position in any stocks mentioned.
About LSE:GFTU
Grafton Group
Engages in the distribution, retailing, and manufacturing businesses in Ireland, the Netherlands, Finland, and the United Kingdom.
Flawless balance sheet established dividend payer.
