Stock Analysis
- United Kingdom
- /
- Trade Distributors
- /
- LSE:GFTU
Grafton Group (LON:GFTU) stock performs better than its underlying earnings growth over last three years

One simple way to benefit from the stock market is to buy an index fund. But if you pick the right individual stocks, you could make more than that. For example, Grafton Group plc (LON:GFTU) shareholders have seen the share price rise 30% over three years, well in excess of the market return (8.3%, not including dividends).
On the back of a solid 7-day performance, let's check what role the company's fundamentals have played in driving long term shareholder returns.
View our latest analysis for Grafton Group
SWOT Analysis for Grafton Group
- Debt is not viewed as a risk.
- Dividends are covered by earnings and cash flows.
- Earnings growth over the past year underperformed the Trade Distributors industry.
- Dividend is low compared to the top 25% of dividend payers in the Trade Distributors market.
- Good value based on P/E ratio compared to estimated Fair P/E ratio.
- Annual earnings are forecast to decline for the next 3 years.
To quote Buffett, 'Ships will sail around the world but the Flat Earth Society will flourish. There will continue to be wide discrepancies between price and value in the marketplace...' By comparing earnings per share (EPS) and share price changes over time, we can get a feel for how investor attitudes to a company have morphed over time.
During three years of share price growth, Grafton Group achieved compound earnings per share growth of 17% per year. The average annual share price increase of 9% is actually lower than the EPS growth. Therefore, it seems the market has moderated its expectations for growth, somewhat. We'd venture the lowish P/E ratio of 8.79 also reflects the negative sentiment around the stock.
The company's earnings per share (over time) is depicted in the image below (click to see the exact numbers).
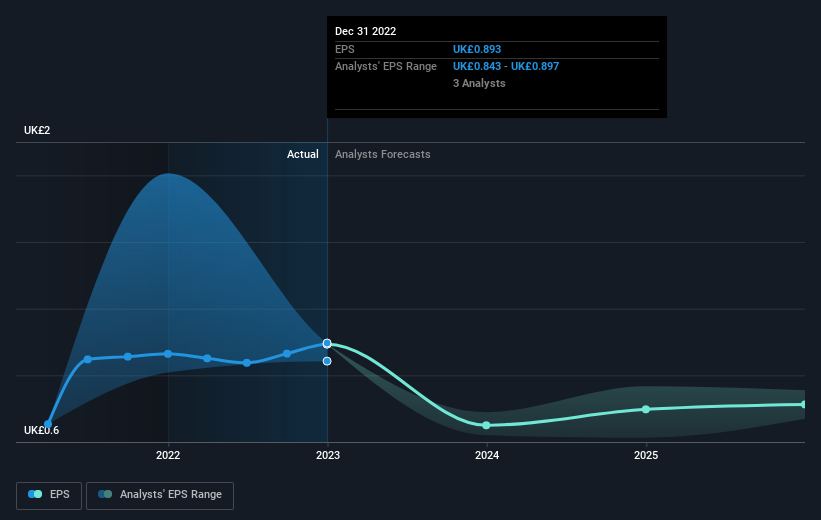
It's probably worth noting we've seen significant insider buying in the last quarter, which we consider a positive. That said, we think earnings and revenue growth trends are even more important factors to consider. It might be well worthwhile taking a look at our free report on Grafton Group's earnings, revenue and cash flow.
What About Dividends?
As well as measuring the share price return, investors should also consider the total shareholder return (TSR). The TSR incorporates the value of any spin-offs or discounted capital raisings, along with any dividends, based on the assumption that the dividends are reinvested. Arguably, the TSR gives a more comprehensive picture of the return generated by a stock. In the case of Grafton Group, it has a TSR of 43% for the last 3 years. That exceeds its share price return that we previously mentioned. The dividends paid by the company have thusly boosted the total shareholder return.
A Different Perspective
Investors in Grafton Group had a tough year, with a total loss of 4.3% (including dividends), against a market gain of about 0.1%. However, keep in mind that even the best stocks will sometimes underperform the market over a twelve month period. Longer term investors wouldn't be so upset, since they would have made 3%, each year, over five years. It could be that the recent sell-off is an opportunity, so it may be worth checking the fundamental data for signs of a long term growth trend. It's always interesting to track share price performance over the longer term. But to understand Grafton Group better, we need to consider many other factors. Case in point: We've spotted 1 warning sign for Grafton Group you should be aware of.
There are plenty of other companies that have insiders buying up shares. You probably do not want to miss this free list of growing companies that insiders are buying.
Please note, the market returns quoted in this article reflect the market weighted average returns of stocks that currently trade on British exchanges.
Valuation is complex, but we're helping make it simple.
Find out whether Grafton Group is potentially over or undervalued by checking out our comprehensive analysis, which includes fair value estimates, risks and warnings, dividends, insider transactions and financial health.
View the Free AnalysisHave feedback on this article? Concerned about the content? Get in touch with us directly. Alternatively, email editorial-team (at) simplywallst.com.
This article by Simply Wall St is general in nature. We provide commentary based on historical data and analyst forecasts only using an unbiased methodology and our articles are not intended to be financial advice. It does not constitute a recommendation to buy or sell any stock, and does not take account of your objectives, or your financial situation. We aim to bring you long-term focused analysis driven by fundamental data. Note that our analysis may not factor in the latest price-sensitive company announcements or qualitative material. Simply Wall St has no position in any stocks mentioned.
About LSE:GFTU
Grafton Group
Grafton Group plc engages in the distribution, retailing, and manufacturing businesses in Ireland, the Netherlands, Finland, and the United Kingdom.
Flawless balance sheet, undervalued and pays a dividend.

