
Advertisement
- United Kingdom
- /
- Industrials
- /
- LSE:DCC
Does DCC's (LON:DCC) Share Price Gain of 85% Match Its Business Performance?

When we invest, we're generally looking for stocks that outperform the market average. And while active stock picking involves risks (and requires diversification) it can also provide excess returns. To wit, the DCC share price has climbed 85% in five years, easily topping the market return of 8.7% (ignoring dividends). On the other hand, the more recent gains haven't been so impressive, with shareholders gaining just 11% , including dividends .
View our latest analysis for DCC
While markets are a powerful pricing mechanism, share prices reflect investor sentiment, not just underlying business performance. One imperfect but simple way to consider how the market perception of a company has shifted is to compare the change in the earnings per share (EPS) with the share price movement.
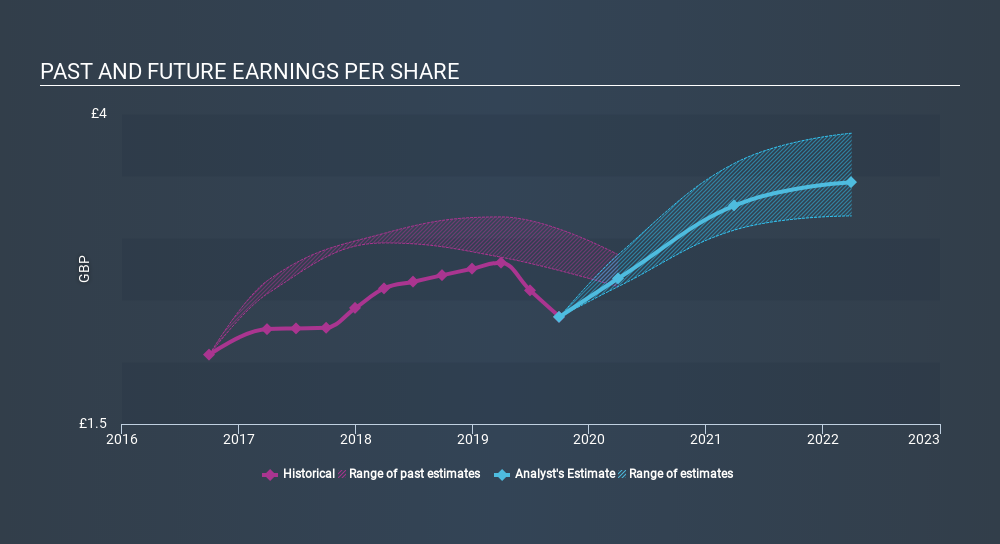
During five years of share price growth, DCC achieved compound earnings per share (EPS) growth of 10% per year. This EPS growth is slower than the share price growth of 13% per year, over the same period. So it's fair to assume the market has a higher opinion of the business than it did five years ago. And that's hardly shocking given the track record of growth.
The company's earnings per share (over time) is depicted in the image below (click to see the exact numbers).
Fundamentally, investors are buying a company's future earnings, but the stability of the business can influence the price they're willing to pay. For example, we've discovered 2 warning signs for DCC (of which 1 is major) which any shareholder or potential investor should be aware of.
What About Dividends?
When looking at investment returns, it is important to consider the difference between total shareholder return (TSR) and share price return. Whereas the share price return only reflects the change in the share price, the TSR includes the value of dividends (assuming they were reinvested) and the benefit of any discounted capital raising or spin-off. It's fair to say that the TSR gives a more complete picture for stocks that pay a dividend. In the case of DCC, it has a TSR of 102% for the last 5 years. That exceeds its share price return that we previously mentioned. And there's no prize for guessing that the dividend payments largely explain the divergence!
A Different Perspective
DCC shareholders gained a total return of 11% during the year. But that return falls short of the market. If we look back over five years, the returns are even better, coming in at 15% per year for five years. Maybe the share price is just taking a breather while the business executes on its growth strategy. Is DCC cheap compared to other companies? These 3 valuation measures might help you decide.
Of course DCC may not be the best stock to buy. So you may wish to see this free collection of growth stocks.
Please note, the market returns quoted in this article reflect the market weighted average returns of stocks that currently trade on GB exchanges.
If you spot an error that warrants correction, please contact the editor at editorial-team@simplywallst.com. This article by Simply Wall St is general in nature. It does not constitute a recommendation to buy or sell any stock, and does not take account of your objectives, or your financial situation. Simply Wall St has no position in the stocks mentioned.
We aim to bring you long-term focused research analysis driven by fundamental data. Note that our analysis may not factor in the latest price-sensitive company announcements or qualitative material. Thank you for reading.
About LSE:DCC
DCC
Engages in the sales, marketing, and distribution of carbon energy solutions in the Republic of Ireland, the United Kingdom, France, the United States, and internationally.
Flawless balance sheet average dividend payer.
Similar Companies
Market Insights


Advertisement
Community Narratives
For the Emperor: Why Games Workshop Could Be a Star Investment
Fair Value UK£160.00|0.4% overvalued
RO
Community Contributor
Securitas will boost margins with AI and tech-driven services
Fair Value SEK 260.91|44.5% undervalued
UN
Community Contributor
A Leader in EV Charging with Growth Potential
Fair Value €27.00|17.8% undervalued
TI
Community Contributor