
Advertisement
- United Kingdom
- /
- Aerospace & Defense
- /
- AIM:MSI
Returns On Capital Are A Standout For MS INTERNATIONAL (LON:MSI)
What are the early trends we should look for to identify a stock that could multiply in value over the long term? In a perfect world, we'd like to see a company investing more capital into its business and ideally the returns earned from that capital are also increasing. Ultimately, this demonstrates that it's a business that is reinvesting profits at increasing rates of return. So when we looked at the ROCE trend of MS INTERNATIONAL (LON:MSI) we really liked what we saw.
Understanding Return On Capital Employed (ROCE)
For those who don't know, ROCE is a measure of a company's yearly pre-tax profit (its return), relative to the capital employed in the business. Analysts use this formula to calculate it for MS INTERNATIONAL:
Return on Capital Employed = Earnings Before Interest and Tax (EBIT) ÷ (Total Assets - Current Liabilities)
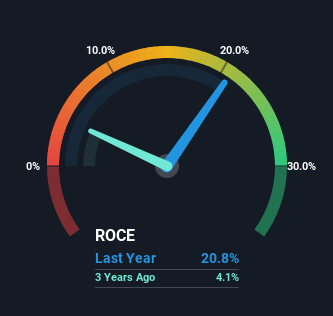
0.21 = UK£13m ÷ (UK£129m - UK£64m) (Based on the trailing twelve months to April 2024).
Therefore, MS INTERNATIONAL has an ROCE of 21%. In absolute terms that's a great return and it's even better than the Aerospace & Defense industry average of 15%.
Check out our latest analysis for MS INTERNATIONAL
While the past is not representative of the future, it can be helpful to know how a company has performed historically, which is why we have this chart above. If you'd like to look at how MS INTERNATIONAL has performed in the past in other metrics, you can view this free graph of MS INTERNATIONAL's past earnings, revenue and cash flow.
So How Is MS INTERNATIONAL's ROCE Trending?
We like the trends that we're seeing from MS INTERNATIONAL. Over the last five years, returns on capital employed have risen substantially to 21%. The company is effectively making more money per dollar of capital used, and it's worth noting that the amount of capital has increased too, by 46%. So we're very much inspired by what we're seeing at MS INTERNATIONAL thanks to its ability to profitably reinvest capital.
On a side note, we noticed that the improvement in ROCE appears to be partly fueled by an increase in current liabilities. The current liabilities has increased to 50% of total assets, so the business is now more funded by the likes of its suppliers or short-term creditors. Given it's pretty high ratio, we'd remind investors that having current liabilities at those levels can bring about some risks in certain businesses.
In Conclusion...
In summary, it's great to see that MS INTERNATIONAL can compound returns by consistently reinvesting capital at increasing rates of return, because these are some of the key ingredients of those highly sought after multi-baggers. Since the stock has returned a staggering 438% to shareholders over the last five years, it looks like investors are recognizing these changes. Therefore, we think it would be worth your time to check if these trends are going to continue.
If you want to continue researching MS INTERNATIONAL, you might be interested to know about the 1 warning sign that our analysis has discovered.
If you want to search for more stocks that have been earning high returns, check out this free list of stocks with solid balance sheets that are also earning high returns on equity.
New: Manage All Your Stock Portfolios in One Place
We've created the ultimate portfolio companion for stock investors, and it's free.
• Connect an unlimited number of Portfolios and see your total in one currency
• Be alerted to new Warning Signs or Risks via email or mobile
• Track the Fair Value of your stocks
Have feedback on this article? Concerned about the content? Get in touch with us directly. Alternatively, email editorial-team (at) simplywallst.com.
This article by Simply Wall St is general in nature. We provide commentary based on historical data and analyst forecasts only using an unbiased methodology and our articles are not intended to be financial advice. It does not constitute a recommendation to buy or sell any stock, and does not take account of your objectives, or your financial situation. We aim to bring you long-term focused analysis driven by fundamental data. Note that our analysis may not factor in the latest price-sensitive company announcements or qualitative material. Simply Wall St has no position in any stocks mentioned.
Have feedback on this article? Concerned about the content? Get in touch with us directly. Alternatively, email editorial-team@simplywallst.com
About AIM:MSI
MS INTERNATIONAL
Engages in the design, manufacture, construction, and servicing various engineering products and structures in the United Kingdom, Europe, the United States of America, Asia, South America, and internationally.
Flawless balance sheet with acceptable track record.
Market Insights

Advertisement
Community Narratives
100% Patient Improvement in trial puts this $16M Biotech on the radar
Fair Value US$5.30|69.8% undervalued
JO
Community Contributor
Exxon Mobil's 17.5% Upside Promises Industry-Leading Returns in Energy Transition
Fair Value US$132.00|15.0% undervalued
HE
Community Contributor
NHC Analysis: Quality at a Good Price. A Golden Opportunity?
Fair Value US$179.80|36.1% undervalued
DA
Community Contributor
Product Refresh And Global Expansion Will Empower Future Market Leadership
Fair Value US$202.60|21.1% undervalued
AN
Based on Analyst Price Targets