
Advertisement
Key Insights
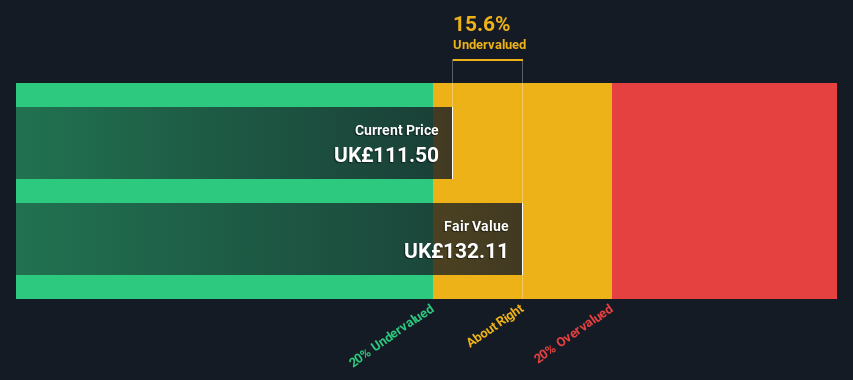
- Judges Scientific's estimated fair value is UK£132 based on 2 Stage Free Cash Flow to Equity
- With UK£112 share price, Judges Scientific appears to be trading close to its estimated fair value
- Our fair value estimate is 29% higher than Judges Scientific's analyst price target of UK£102
Today we will run through one way of estimating the intrinsic value of Judges Scientific plc (LON:JDG) by taking the forecast future cash flows of the company and discounting them back to today's value. We will take advantage of the Discounted Cash Flow (DCF) model for this purpose. Don't get put off by the jargon, the math behind it is actually quite straightforward.
We would caution that there are many ways of valuing a company and, like the DCF, each technique has advantages and disadvantages in certain scenarios. If you still have some burning questions about this type of valuation, take a look at the Simply Wall St analysis model.
See our latest analysis for Judges Scientific
The Model
We use what is known as a 2-stage model, which simply means we have two different periods of growth rates for the company's cash flows. Generally the first stage is higher growth, and the second stage is a lower growth phase. In the first stage we need to estimate the cash flows to the business over the next ten years. Where possible we use analyst estimates, but when these aren't available we extrapolate the previous free cash flow (FCF) from the last estimate or reported value. We assume companies with shrinking free cash flow will slow their rate of shrinkage, and that companies with growing free cash flow will see their growth rate slow, over this period. We do this to reflect that growth tends to slow more in the early years than it does in later years.
A DCF is all about the idea that a dollar in the future is less valuable than a dollar today, so we need to discount the sum of these future cash flows to arrive at a present value estimate:
10-year free cash flow (FCF) forecast
| 2024 | 2025 | 2026 | 2027 | 2028 | 2029 | 2030 | 2031 | 2032 | 2033 | |
| Levered FCF (£, Millions) | UK£22.6m | UK£25.9m | UK£37.1m | UK£43.9m | UK£49.7m | UK£54.6m | UK£58.6m | UK£61.9m | UK£64.6m | UK£67.0m |
| Growth Rate Estimate Source | Analyst x4 | Analyst x4 | Analyst x1 | Est @ 18.27% | Est @ 13.28% | Est @ 9.79% | Est @ 7.35% | Est @ 5.63% | Est @ 4.44% | Est @ 3.60% |
| Present Value (£, Millions) Discounted @ 7.5% | UK£21.0 | UK£22.4 | UK£29.9 | UK£32.8 | UK£34.6 | UK£35.3 | UK£35.3 | UK£34.7 | UK£33.7 | UK£32.5 |
("Est" = FCF growth rate estimated by Simply Wall St)
Present Value of 10-year Cash Flow (PVCF) = UK£312m
After calculating the present value of future cash flows in the initial 10-year period, we need to calculate the Terminal Value, which accounts for all future cash flows beyond the first stage. For a number of reasons a very conservative growth rate is used that cannot exceed that of a country's GDP growth. In this case we have used the 5-year average of the 10-year government bond yield (1.6%) to estimate future growth. In the same way as with the 10-year 'growth' period, we discount future cash flows to today's value, using a cost of equity of 7.5%.
Terminal Value (TV)= FCF2033 × (1 + g) ÷ (r – g) = UK£67m× (1 + 1.6%) ÷ (7.5%– 1.6%) = UK£1.2b
Present Value of Terminal Value (PVTV)= TV / (1 + r)10= UK£1.2b÷ ( 1 + 7.5%)10= UK£562m
The total value, or equity value, is then the sum of the present value of the future cash flows, which in this case is UK£874m. To get the intrinsic value per share, we divide this by the total number of shares outstanding. Relative to the current share price of UK£112, the company appears about fair value at a 16% discount to where the stock price trades currently. Valuations are imprecise instruments though, rather like a telescope - move a few degrees and end up in a different galaxy. Do keep this in mind.
The Assumptions
Now the most important inputs to a discounted cash flow are the discount rate, and of course, the actual cash flows. Part of investing is coming up with your own evaluation of a company's future performance, so try the calculation yourself and check your own assumptions. The DCF also does not consider the possible cyclicality of an industry, or a company's future capital requirements, so it does not give a full picture of a company's potential performance. Given that we are looking at Judges Scientific as potential shareholders, the cost of equity is used as the discount rate, rather than the cost of capital (or weighted average cost of capital, WACC) which accounts for debt. In this calculation we've used 7.5%, which is based on a levered beta of 1.071. Beta is a measure of a stock's volatility, compared to the market as a whole. We get our beta from the industry average beta of globally comparable companies, with an imposed limit between 0.8 and 2.0, which is a reasonable range for a stable business.
SWOT Analysis for Judges Scientific
Strength
- Debt is well covered by earnings and cashflows.
Weakness
- Earnings declined over the past year.
- Dividend is low compared to the top 25% of dividend payers in the Machinery market.
- Shareholders have been diluted in the past year.
Opportunity
- Annual earnings are forecast to grow faster than the British market.
- Current share price is below our estimate of fair value.
Threat
- Revenue is forecast to grow slower than 20% per year.
Next Steps:
Valuation is only one side of the coin in terms of building your investment thesis, and it ideally won't be the sole piece of analysis you scrutinize for a company. DCF models are not the be-all and end-all of investment valuation. Rather it should be seen as a guide to "what assumptions need to be true for this stock to be under/overvalued?" For instance, if the terminal value growth rate is adjusted slightly, it can dramatically alter the overall result. For Judges Scientific, there are three additional factors you should look at:
- Risks: For example, we've discovered 4 warning signs for Judges Scientific that you should be aware of before investing here.
- Future Earnings: How does JDG's growth rate compare to its peers and the wider market? Dig deeper into the analyst consensus number for the upcoming years by interacting with our free analyst growth expectation chart.
- Other High Quality Alternatives: Do you like a good all-rounder? Explore our interactive list of high quality stocks to get an idea of what else is out there you may be missing!
PS. The Simply Wall St app conducts a discounted cash flow valuation for every stock on the AIM every day. If you want to find the calculation for other stocks just search here.
New: Manage All Your Stock Portfolios in One Place
We've created the ultimate portfolio companion for stock investors, and it's free.
• Connect an unlimited number of Portfolios and see your total in one currency
• Be alerted to new Warning Signs or Risks via email or mobile
• Track the Fair Value of your stocks
Have feedback on this article? Concerned about the content? Get in touch with us directly. Alternatively, email editorial-team (at) simplywallst.com.
This article by Simply Wall St is general in nature. We provide commentary based on historical data and analyst forecasts only using an unbiased methodology and our articles are not intended to be financial advice. It does not constitute a recommendation to buy or sell any stock, and does not take account of your objectives, or your financial situation. We aim to bring you long-term focused analysis driven by fundamental data. Note that our analysis may not factor in the latest price-sensitive company announcements or qualitative material. Simply Wall St has no position in any stocks mentioned.
About AIM:JDG
Judges Scientific
Designs, manufactures, and sells scientific instruments and services.
Adequate balance sheet average dividend payer.
Market Insights

Advertisement
Community Narratives
MicroVision will explode future revenue by 380.37% with a vision towards success
Fair Value US$60|98.4% undervalued
TH
Community Contributor
The Indispensable Artery for a New North American Economy
Fair Value CA$132.87|0.8% undervalued
TI
Community Contributor
Recently Updated Narratives
CO

composite32 on TAV Havalimanlari Holding ·
TAV Havalimanlari Holding will fly high with 25.68% revenue growth
Fair Value:₺545.1648.6% undervalued
3 followersusers have followed this narrative
0 commentsusers have commented on this narrative
0 likesusers have liked this narrative
RO


Robbo on Fiducian Group ·
Fiducian: Compliance Clouds or Value Opportunity?
Fair Value:AU$122.3% overvalued
1 followerusers have followed this narrative
0 commentsusers have commented on this narrative
0 likesusers have liked this narrative
MA


MarkoVT on COVER ·
Q3 Outlook modestly optimistic
Fair Value:JP¥1.65k2.0% overvalued
1 followerusers have followed this narrative
0 commentsusers have commented on this narrative
0 likesusers have liked this narrative
Popular Narratives
TH

TheWallstreetKing on MicroVision ·
MicroVision will explode future revenue by 380.37% with a vision towards success
Fair Value:US$6098.4% undervalued
92 followersusers have followed this narrative
10 commentsusers have commented on this narrative
18 likesusers have liked this narrative
OS


oscargarcia on Alphabet ·
The company that turned a verb into a global necessity and basically runs the modern internet, digital ads, smartphones, maps, and AI.
Fair Value:US$3405.9% undervalued
136 followersusers have followed this narrative
6 commentsusers have commented on this narrative
18 likesusers have liked this narrative
AN


AnalystConsensusTarget on NVIDIA ·
NVDA: Expanding AI Demand Will Drive Major Data Center Investments Through 2026
Fair Value:US$232.7922.6% undervalued
928 followersusers have followed this narrative
6 commentsusers have commented on this narrative
22 likesusers have liked this narrative