
Advertisement
- United Kingdom
- /
- Construction
- /
- AIM:DIAL
There's Been No Shortage Of Growth Recently For Driver Group's (LON:DRV) Returns On Capital

There are a few key trends to look for if we want to identify the next multi-bagger. In a perfect world, we'd like to see a company investing more capital into its business and ideally the returns earned from that capital are also increasing. This shows us that it's a compounding machine, able to continually reinvest its earnings back into the business and generate higher returns. Speaking of which, we noticed some great changes in Driver Group's (LON:DRV) returns on capital, so let's have a look.
What Is Return On Capital Employed (ROCE)?
Just to clarify if you're unsure, ROCE is a metric for evaluating how much pre-tax income (in percentage terms) a company earns on the capital invested in its business. The formula for this calculation on Driver Group is:
Return on Capital Employed = Earnings Before Interest and Tax (EBIT) ÷ (Total Assets - Current Liabilities)
0.072 = UK£1.5m ÷ (UK£31m - UK£9.9m) (Based on the trailing twelve months to March 2022).
Thus, Driver Group has an ROCE of 7.2%. On its own, that's a low figure but it's around the 8.7% average generated by the Construction industry.
See our latest analysis for Driver Group
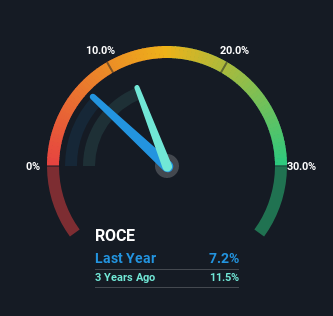
Historical performance is a great place to start when researching a stock so above you can see the gauge for Driver Group's ROCE against it's prior returns. If you'd like to look at how Driver Group has performed in the past in other metrics, you can view this free graph of past earnings, revenue and cash flow.
What Does the ROCE Trend For Driver Group Tell Us?
Driver Group has not disappointed with their ROCE growth. Looking at the data, we can see that even though capital employed in the business has remained relatively flat, the ROCE generated has risen by 2,260% over the last five years. So it's likely that the business is now reaping the full benefits of its past investments, since the capital employed hasn't changed considerably. The company is doing well in that sense, and it's worth investigating what the management team has planned for long term growth prospects.
In Conclusion...
To bring it all together, Driver Group has done well to increase the returns it's generating from its capital employed. And since the stock has fallen 54% over the last five years, there might be an opportunity here. That being the case, research into the company's current valuation metrics and future prospects seems fitting.
One more thing: We've identified 4 warning signs with Driver Group (at least 2 which make us uncomfortable) , and understanding these would certainly be useful.
While Driver Group isn't earning the highest return, check out this free list of companies that are earning high returns on equity with solid balance sheets.
New: Manage All Your Stock Portfolios in One Place
We've created the ultimate portfolio companion for stock investors, and it's free.
• Connect an unlimited number of Portfolios and see your total in one currency
• Be alerted to new Warning Signs or Risks via email or mobile
• Track the Fair Value of your stocks
Have feedback on this article? Concerned about the content? Get in touch with us directly. Alternatively, email editorial-team (at) simplywallst.com.
This article by Simply Wall St is general in nature. We provide commentary based on historical data and analyst forecasts only using an unbiased methodology and our articles are not intended to be financial advice. It does not constitute a recommendation to buy or sell any stock, and does not take account of your objectives, or your financial situation. We aim to bring you long-term focused analysis driven by fundamental data. Note that our analysis may not factor in the latest price-sensitive company announcements or qualitative material. Simply Wall St has no position in any stocks mentioned.
About AIM:DIAL
Diales Group
Provides various consultancy services to the engineering and construction industries.
Flawless balance sheet slight.
Market Insights


Advertisement
Community Narratives
The Future of Drug Testing? Fingerprint Tech Shows Serious Promise
Fair Value US$2.98|40.3% undervalued
JO
Community Contributor
Suncorp’s Next Chapter: Insurance-Only and Ready to Grow
Fair Value AU$22.83|7.6% undervalued
RO
Community Contributor
Thyssenkrupp Nucera Will Achieve Double-Digit Profits by 2030 Boosted by Hydrogen Growth
Fair Value €14.40|31.6% undervalued
CH
Community Contributor
Tesla’s Nvidia Moment – The AI & Robotics Inflection Point
Fair Value US$359.72|12.3% undervalued
BL
Community Contributor