Stock Analysis
- United Kingdom
- /
- Banks
- /
- LSE:STAN
Standard Chartered's (LON:STAN) investors will be pleased with their respectable 41% return over the last three years


One simple way to benefit from the stock market is to buy an index fund. But if you pick the right individual stocks, you could make more than that. Just take a look at Standard Chartered PLC (LON:STAN), which is up 33%, over three years, soundly beating the market return of 1.2% (not including dividends).
With that in mind, it's worth seeing if the company's underlying fundamentals have been the driver of long term performance, or if there are some discrepancies.
See our latest analysis for Standard Chartered
There is no denying that markets are sometimes efficient, but prices do not always reflect underlying business performance. One imperfect but simple way to consider how the market perception of a company has shifted is to compare the change in the earnings per share (EPS) with the share price movement.
During three years of share price growth, Standard Chartered achieved compound earnings per share growth of 52% per year. The average annual share price increase of 10% is actually lower than the EPS growth. So it seems investors have become more cautious about the company, over time. We'd venture the lowish P/E ratio of 10.89 also reflects the negative sentiment around the stock.
The image below shows how EPS has tracked over time (if you click on the image you can see greater detail).
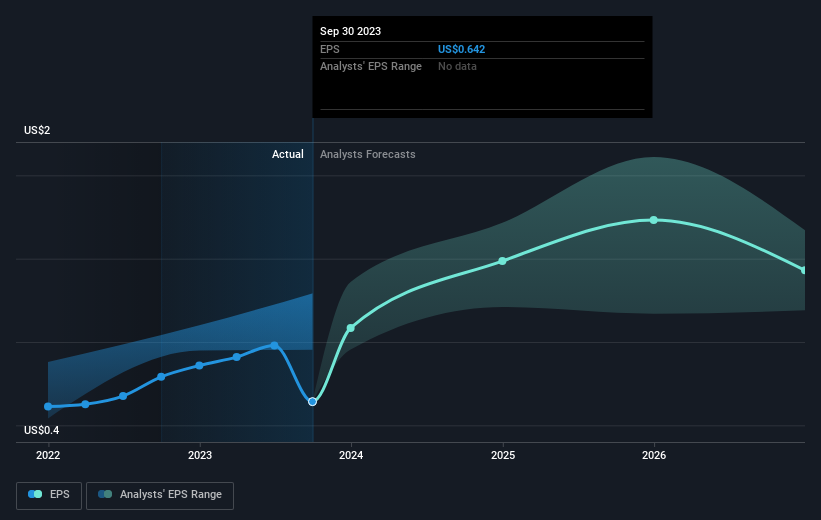
We know that Standard Chartered has improved its bottom line over the last three years, but what does the future have in store? You can see how its balance sheet has strengthened (or weakened) over time in this free interactive graphic.
What About Dividends?
It is important to consider the total shareholder return, as well as the share price return, for any given stock. The TSR is a return calculation that accounts for the value of cash dividends (assuming that any dividend received was reinvested) and the calculated value of any discounted capital raisings and spin-offs. It's fair to say that the TSR gives a more complete picture for stocks that pay a dividend. In the case of Standard Chartered, it has a TSR of 41% for the last 3 years. That exceeds its share price return that we previously mentioned. The dividends paid by the company have thusly boosted the total shareholder return.
A Different Perspective
While the broader market lost about 3.3% in the twelve months, Standard Chartered shareholders did even worse, losing 10% (even including dividends). However, it could simply be that the share price has been impacted by broader market jitters. It might be worth keeping an eye on the fundamentals, in case there's a good opportunity. Longer term investors wouldn't be so upset, since they would have made 0.9%, each year, over five years. If the fundamental data continues to indicate long term sustainable growth, the current sell-off could be an opportunity worth considering. It's always interesting to track share price performance over the longer term. But to understand Standard Chartered better, we need to consider many other factors. Even so, be aware that Standard Chartered is showing 1 warning sign in our investment analysis , you should know about...
For those who like to find winning investments this free list of growing companies with recent insider purchasing, could be just the ticket.
Please note, the market returns quoted in this article reflect the market weighted average returns of stocks that currently trade on British exchanges.
Valuation is complex, but we're helping make it simple.
Find out whether Standard Chartered is potentially over or undervalued by checking out our comprehensive analysis, which includes fair value estimates, risks and warnings, dividends, insider transactions and financial health.
View the Free AnalysisHave feedback on this article? Concerned about the content? Get in touch with us directly. Alternatively, email editorial-team (at) simplywallst.com.
This article by Simply Wall St is general in nature. We provide commentary based on historical data and analyst forecasts only using an unbiased methodology and our articles are not intended to be financial advice. It does not constitute a recommendation to buy or sell any stock, and does not take account of your objectives, or your financial situation. We aim to bring you long-term focused analysis driven by fundamental data. Note that our analysis may not factor in the latest price-sensitive company announcements or qualitative material. Simply Wall St has no position in any stocks mentioned.
About LSE:STAN
Standard Chartered
Provides various banking products and services in Asia, Africa, the Middle East, Europe, and the Americas.
Adequate balance sheet and fair value.
