
Advertisement
- United Kingdom
- /
- Auto Components
- /
- AIM:CTA
CT Automotive Group plc's (LON:CTA) Stock's On An Uptrend: Are Strong Financials Guiding The Market?

Most readers would already be aware that CT Automotive Group's (LON:CTA) stock increased significantly by 18% over the past week. Given that the market rewards strong financials in the long-term, we wonder if that is the case in this instance. Specifically, we decided to study CT Automotive Group's ROE in this article.
Return on Equity or ROE is a test of how effectively a company is growing its value and managing investors’ money. In simpler terms, it measures the profitability of a company in relation to shareholder's equity.
How Is ROE Calculated?
ROE can be calculated by using the formula:
Return on Equity = Net Profit (from continuing operations) ÷ Shareholders' Equity
So, based on the above formula, the ROE for CT Automotive Group is:
29% = US$7.6m ÷ US$26m (Based on the trailing twelve months to December 2024).
The 'return' refers to a company's earnings over the last year. That means that for every £1 worth of shareholders' equity, the company generated £0.29 in profit.
View our latest analysis for CT Automotive Group
What Is The Relationship Between ROE And Earnings Growth?
So far, we've learned that ROE is a measure of a company's profitability. Depending on how much of these profits the company reinvests or "retains", and how effectively it does so, we are then able to assess a company’s earnings growth potential. Assuming all else is equal, companies that have both a higher return on equity and higher profit retention are usually the ones that have a higher growth rate when compared to companies that don't have the same features.
CT Automotive Group's Earnings Growth And 29% ROE
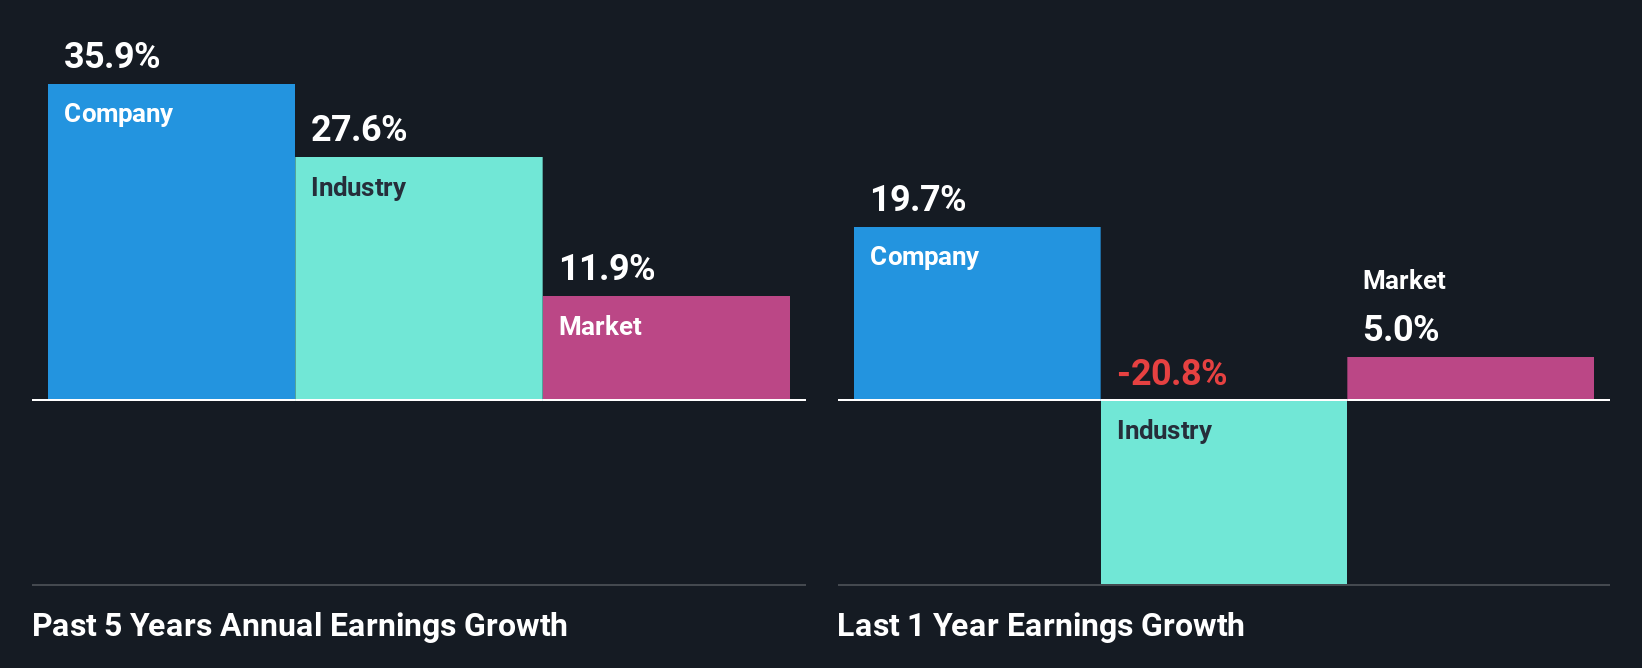
To begin with, CT Automotive Group has a pretty high ROE which is interesting. Second, a comparison with the average ROE reported by the industry of 7.9% also doesn't go unnoticed by us. Under the circumstances, CT Automotive Group's considerable five year net income growth of 36% was to be expected.
We then compared CT Automotive Group's net income growth with the industry and we're pleased to see that the company's growth figure is higher when compared with the industry which has a growth rate of 28% in the same 5-year period.
Earnings growth is an important metric to consider when valuing a stock. It’s important for an investor to know whether the market has priced in the company's expected earnings growth (or decline). This then helps them determine if the stock is placed for a bright or bleak future. One good indicator of expected earnings growth is the P/E ratio which determines the price the market is willing to pay for a stock based on its earnings prospects. So, you may want to check if CT Automotive Group is trading on a high P/E or a low P/E, relative to its industry.
Is CT Automotive Group Making Efficient Use Of Its Profits?
CT Automotive Group doesn't pay any regular dividends to its shareholders, meaning that the company has been reinvesting all of its profits into the business. This is likely what's driving the high earnings growth number discussed above.
Summary
In total, we are pretty happy with CT Automotive Group's performance. Particularly, we like that the company is reinvesting heavily into its business, and at a high rate of return. Unsurprisingly, this has led to an impressive earnings growth. If the company continues to grow its earnings the way it has, that could have a positive impact on its share price given how earnings per share influence long-term share prices. Remember, the price of a stock is also dependent on the perceived risk. Therefore investors must keep themselves informed about the risks involved before investing in any company. You can see the 2 risks we have identified for CT Automotive Group by visiting our risks dashboard for free on our platform here.
New: AI Stock Screener & Alerts
Our new AI Stock Screener scans the market every day to uncover opportunities.
• Dividend Powerhouses (3%+ Yield)
• Undervalued Small Caps with Insider Buying
• High growth Tech and AI Companies
Or build your own from over 50 metrics.
Have feedback on this article? Concerned about the content? Get in touch with us directly. Alternatively, email editorial-team (at) simplywallst.com.
This article by Simply Wall St is general in nature. We provide commentary based on historical data and analyst forecasts only using an unbiased methodology and our articles are not intended to be financial advice. It does not constitute a recommendation to buy or sell any stock, and does not take account of your objectives, or your financial situation. We aim to bring you long-term focused analysis driven by fundamental data. Note that our analysis may not factor in the latest price-sensitive company announcements or qualitative material. Simply Wall St has no position in any stocks mentioned.
About AIM:CTA
CT Automotive Group
Designs, develops, manufactures, and sells automotive interior components and kinematic assemblies for automotive brands in the United Kingdom and internationally.
Excellent balance sheet and good value.
Market Insights

Advertisement
Community Narratives
MINISO's fair value is projected at 26.69 with an anticipated PE ratio shift of 20x
Fair Value US$24.03|11.0% undervalued
BE
Community Contributor
Procter & Gamble: A Dividend Giant Facing Slowing Growth
Fair Value US$119.81|23.3% overvalued
AN
Community Contributor
Eli Lilly's Future Growth Driven by Tirzepatide and Favorable Market Conditions
Fair Value US$1.19k|13.8% undervalued
EA
Community Contributor