- France
- /
- Electronic Equipment and Components
- /
- ENXTPA:PID
There Are Reasons To Feel Uneasy About Paragon ID's (EPA:PID) Returns On Capital


What trends should we look for it we want to identify stocks that can multiply in value over the long term? One common approach is to try and find a company with returns on capital employed (ROCE) that are increasing, in conjunction with a growing amount of capital employed. Basically this means that a company has profitable initiatives that it can continue to reinvest in, which is a trait of a compounding machine. Having said that, from a first glance at Paragon ID (EPA:PID) we aren't jumping out of our chairs at how returns are trending, but let's have a deeper look.
Understanding Return On Capital Employed (ROCE)
If you haven't worked with ROCE before, it measures the 'return' (pre-tax profit) a company generates from capital employed in its business. To calculate this metric for Paragon ID, this is the formula:
Return on Capital Employed = Earnings Before Interest and Tax (EBIT) ÷ (Total Assets - Current Liabilities)
0.027 = €2.2m ÷ (€169m - €87m) (Based on the trailing twelve months to December 2022).
Thus, Paragon ID has an ROCE of 2.7%. In absolute terms, that's a low return and it also under-performs the Electronic industry average of 6.5%.
View our latest analysis for Paragon ID
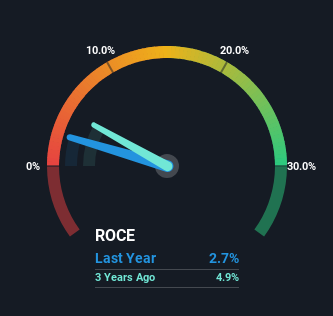
Historical performance is a great place to start when researching a stock so above you can see the gauge for Paragon ID's ROCE against it's prior returns. If you're interested in investigating Paragon ID's past further, check out this free graph of past earnings, revenue and cash flow.
SWOT Analysis for Paragon ID
- Debt is well covered by .
- Interest payments on debt are not well covered.
- PID's financial characteristics indicate limited near-term opportunities for shareholders.
- Lack of analyst coverage makes it difficult to determine PID's earnings prospects.
- Debt is not well covered by operating cash flow.
- Has less than 3 years of cash runway based on current free cash flow.
What Can We Tell From Paragon ID's ROCE Trend?
In terms of Paragon ID's historical ROCE movements, the trend isn't fantastic. Around five years ago the returns on capital were 8.0%, but since then they've fallen to 2.7%. However, given capital employed and revenue have both increased it appears that the business is currently pursuing growth, at the consequence of short term returns. And if the increased capital generates additional returns, the business, and thus shareholders, will benefit in the long run.
On a side note, Paragon ID's current liabilities are still rather high at 52% of total assets. This can bring about some risks because the company is basically operating with a rather large reliance on its suppliers or other sorts of short-term creditors. Ideally we'd like to see this reduce as that would mean fewer obligations bearing risks.
What We Can Learn From Paragon ID's ROCE
Even though returns on capital have fallen in the short term, we find it promising that revenue and capital employed have both increased for Paragon ID. These trends are starting to be recognized by investors since the stock has delivered a 30% gain to shareholders who've held over the last five years. So this stock may still be an appealing investment opportunity, if other fundamentals prove to be sound.
One final note, you should learn about the 4 warning signs we've spotted with Paragon ID (including 3 which make us uncomfortable) .
While Paragon ID may not currently earn the highest returns, we've compiled a list of companies that currently earn more than 25% return on equity. Check out this free list here.
New: Manage All Your Stock Portfolios in One Place
We've created the ultimate portfolio companion for stock investors, and it's free.
• Connect an unlimited number of Portfolios and see your total in one currency
• Be alerted to new Warning Signs or Risks via email or mobile
• Track the Fair Value of your stocks
Have feedback on this article? Concerned about the content? Get in touch with us directly. Alternatively, email editorial-team (at) simplywallst.com.
This article by Simply Wall St is general in nature. We provide commentary based on historical data and analyst forecasts only using an unbiased methodology and our articles are not intended to be financial advice. It does not constitute a recommendation to buy or sell any stock, and does not take account of your objectives, or your financial situation. We aim to bring you long-term focused analysis driven by fundamental data. Note that our analysis may not factor in the latest price-sensitive company announcements or qualitative material. Simply Wall St has no position in any stocks mentioned.
About ENXTPA:PID
Acceptable track record and slightly overvalued.
Market Insights

Community Narratives

