
Advertisement
Howard Marks put it nicely when he said that, rather than worrying about share price volatility, 'The possibility of permanent loss is the risk I worry about... and every practical investor I know worries about.' It's only natural to consider a company's balance sheet when you examine how risky it is, since debt is often involved when a business collapses. Importantly, Kerlink SA (EPA:ALKLK) does carry debt. But is this debt a concern to shareholders?
When Is Debt Dangerous?
Generally speaking, debt only becomes a real problem when a company can't easily pay it off, either by raising capital or with its own cash flow. In the worst case scenario, a company can go bankrupt if it cannot pay its creditors. However, a more usual (but still expensive) situation is where a company must dilute shareholders at a cheap share price simply to get debt under control. Having said that, the most common situation is where a company manages its debt reasonably well - and to its own advantage. When we examine debt levels, we first consider both cash and debt levels, together.
Check out our latest analysis for Kerlink
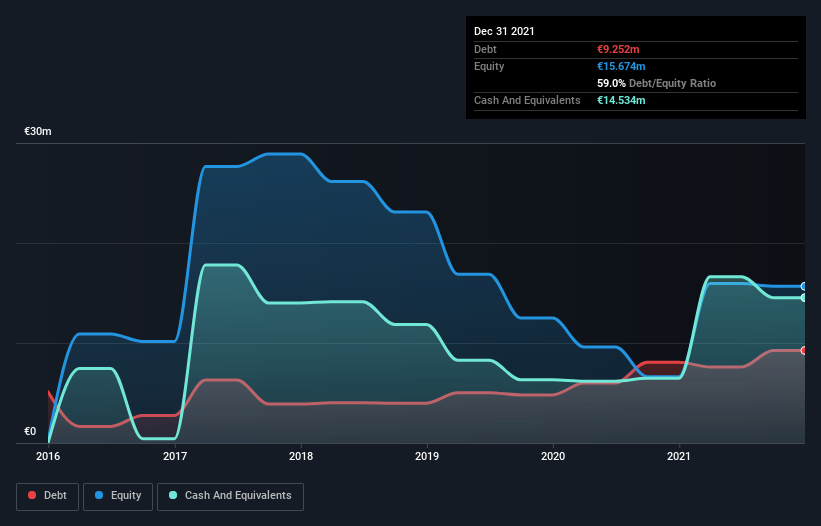
What Is Kerlink's Net Debt?
As you can see below, at the end of December 2021, Kerlink had €9.25m of debt, up from €8.08m a year ago. Click the image for more detail. But it also has €14.5m in cash to offset that, meaning it has €5.28m net cash.
How Strong Is Kerlink's Balance Sheet?
Zooming in on the latest balance sheet data, we can see that Kerlink had liabilities of €11.9m due within 12 months and liabilities of €5.55m due beyond that. Offsetting these obligations, it had cash of €14.5m as well as receivables valued at €5.80m due within 12 months. So it actually has €2.92m more liquid assets than total liabilities.
This surplus suggests that Kerlink has a conservative balance sheet, and could probably eliminate its debt without much difficulty. Succinctly put, Kerlink boasts net cash, so it's fair to say it does not have a heavy debt load! When analysing debt levels, the balance sheet is the obvious place to start. But ultimately the future profitability of the business will decide if Kerlink can strengthen its balance sheet over time. So if you're focused on the future you can check out this free report showing analyst profit forecasts.
Over 12 months, Kerlink reported revenue of €20m, which is a gain of 78%, although it did not report any earnings before interest and tax. Shareholders probably have their fingers crossed that it can grow its way to profits.
So How Risky Is Kerlink?
We have no doubt that loss making companies are, in general, riskier than profitable ones. And in the last year Kerlink had an earnings before interest and tax (EBIT) loss, truth be told. And over the same period it saw negative free cash outflow of €3.0m and booked a €1.8m accounting loss. But at least it has €5.28m on the balance sheet to spend on growth, near-term. Kerlink's revenue growth shone bright over the last year, so it may well be in a position to turn a profit in due course. Pre-profit companies are often risky, but they can also offer great rewards. When analysing debt levels, the balance sheet is the obvious place to start. However, not all investment risk resides within the balance sheet - far from it. For example, we've discovered 2 warning signs for Kerlink that you should be aware of before investing here.
If, after all that, you're more interested in a fast growing company with a rock-solid balance sheet, then check out our list of net cash growth stocks without delay.
Valuation is complex, but we're here to simplify it.
Discover if Kerlink might be undervalued or overvalued with our detailed analysis, featuring fair value estimates, potential risks, dividends, insider trades, and its financial condition.
Access Free AnalysisHave feedback on this article? Concerned about the content? Get in touch with us directly. Alternatively, email editorial-team (at) simplywallst.com.
This article by Simply Wall St is general in nature. We provide commentary based on historical data and analyst forecasts only using an unbiased methodology and our articles are not intended to be financial advice. It does not constitute a recommendation to buy or sell any stock, and does not take account of your objectives, or your financial situation. We aim to bring you long-term focused analysis driven by fundamental data. Note that our analysis may not factor in the latest price-sensitive company announcements or qualitative material. Simply Wall St has no position in any stocks mentioned.
About ENXTPA:ALKLK
Kerlink
Provides network infrastructure solutions for the Internet of Things (IoT) market to historical and alternative operators, businesses, and utilities in Europe, the Middle East, Africa, the Asia-Pacific, and the Americas.
High growth potential with adequate balance sheet.
Market Insights

Advertisement
Weekly Picks
RO


RockeTeller on Santacruz Silver Mining ·
Crazy Undervalued 42 Baggers Silver Play (Active & Running Mine)
Fair Value:CA$8696.7% undervalued
50 followersusers have followed this narrative
6 commentsusers have commented on this narrative
16 likesusers have liked this narrative
RO


Robbo on Fiducian Group ·
Fiducian: Compliance Clouds or Value Opportunity?
Fair Value:AU$122.0% undervalued
7 followersusers have followed this narrative
0 commentsusers have commented on this narrative
0 likesusers have liked this narrative
WO

woodworthfund on Willamette Valley Vineyards ·
Willamette Valley Vineyards (WVVI): Not-So-Great Value
Fair Value:US$242.5% overvalued
10 followersusers have followed this narrative
0 commentsusers have commented on this narrative
1 likeusers have liked this narrative
Recently Updated Narratives
MO


mo7md on ADNOC Gas ·
ADNOC Gas future shines with a 21.4% revenue surge
Fair Value:د.إ3.728.9% undervalued
1 followerusers have followed this narrative
0 commentsusers have commented on this narrative
0 likesusers have liked this narrative
IN

IncomeAssets on Pulse Seismic ·
Watch Pulse Seismic Outperform with 13.6% Revenue Growth in the Coming Years
Fair Value:CA$4.4727.3% undervalued
3 followersusers have followed this narrative
0 commentsusers have commented on this narrative
0 likesusers have liked this narrative
VL

Vladislav on Galleon Gold ·
Significantly undervalued gold explorer in Timmins, finally getting traction
Fair Value:CA$481.5% undervalued
6 followersusers have followed this narrative
0 commentsusers have commented on this narrative
0 likesusers have liked this narrative
Popular Narratives
TH


TheWallstreetKing on MicroVision ·
MicroVision will explode future revenue by 380.37% with a vision towards success
Fair Value:US$6098.5% undervalued
116 followersusers have followed this narrative
11 commentsusers have commented on this narrative
22 likesusers have liked this narrative
AN


AnalystConsensusTarget on NVIDIA ·
NVDA: Expanding AI Demand Will Drive Major Data Center Investments Through 2026
Fair Value:US$250.3927.2% undervalued
957 followersusers have followed this narrative
6 commentsusers have commented on this narrative
25 likesusers have liked this narrative
RO
RockeTeller on Santacruz Silver Mining ·
Crazy Undervalued 42 Baggers Silver Play (Active & Running Mine)
Fair Value:CA$8696.7% undervalued
50 followersusers have followed this narrative
6 commentsusers have commented on this narrative
16 likesusers have liked this narrative

