
Advertisement
- France
- /
- Communications
- /
- ENXTPA:ALKLK
Investors Still Aren't Entirely Convinced By Kerlink SA's (EPA:ALKLK) Revenues Despite 27% Price Jump
Kerlink SA (EPA:ALKLK) shares have continued their recent momentum with a 27% gain in the last month alone. Notwithstanding the latest gain, the annual share price return of 5.4% isn't as impressive.
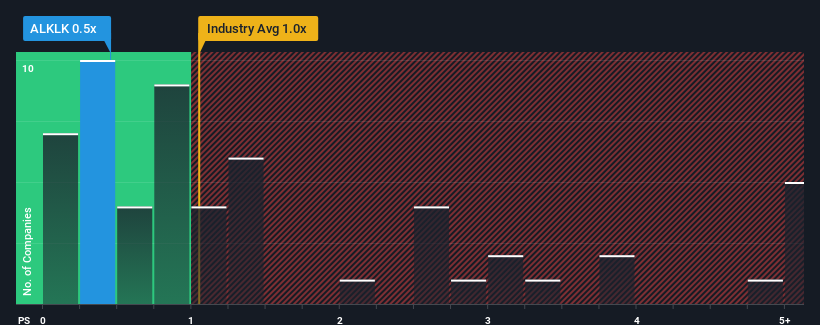
Although its price has surged higher, there still wouldn't be many who think Kerlink's price-to-sales (or "P/S") ratio of 0.5x is worth a mention when the median P/S in France's Communications industry is similar at about 0.6x. While this might not raise any eyebrows, if the P/S ratio is not justified investors could be missing out on a potential opportunity or ignoring looming disappointment.
View our latest analysis for Kerlink
What Does Kerlink's Recent Performance Look Like?
Kerlink could be doing better as its revenue has been going backwards lately while most other companies have been seeing positive revenue growth. One possibility is that the P/S ratio is moderate because investors think this poor revenue performance will turn around. You'd really hope so, otherwise you're paying a relatively elevated price for a company with this sort of growth profile.
Keen to find out how analysts think Kerlink's future stacks up against the industry? In that case, our free report is a great place to start.What Are Revenue Growth Metrics Telling Us About The P/S?
The only time you'd be comfortable seeing a P/S like Kerlink's is when the company's growth is tracking the industry closely.
Taking a look back first, the company's revenue growth last year wasn't something to get excited about as it posted a disappointing decline of 31%. However, a few very strong years before that means that it was still able to grow revenue by an impressive 36% in total over the last three years. Although it's been a bumpy ride, it's still fair to say the revenue growth recently has been more than adequate for the company.
Shifting to the future, estimates from the lone analyst covering the company suggest revenue growth will show minor resilience over the next year growing only by 0.8%. Meanwhile, the broader industry is forecast to contract by 2.1%, which would indicate the company is doing better than the majority of its peers.
Even though the growth is only slight, it's peculiar that Kerlink's P/S sits in line with the majority of other companies given the industry is set for a decline. Apparently some shareholders are skeptical of the contrarian forecasts and have been accepting lower selling prices.
The Bottom Line On Kerlink's P/S
Kerlink's stock has a lot of momentum behind it lately, which has brought its P/S level with the rest of the industry. We'd say the price-to-sales ratio's power isn't primarily as a valuation instrument but rather to gauge current investor sentiment and future expectations.
We've established that Kerlink currently trades on a lower than expected P/S since its growth forecasts are potentially beating a struggling industry. There could be some unobserved threats to revenue preventing the P/S ratio from matching the positive outlook. Perhaps there is some hesitation about the company's ability to keep swimming against the current of the broader industry turmoil. At least the risk of a price drop looks to be subdued, but investors seem to think future revenue could see some volatility.
Don't forget that there may be other risks. For instance, we've identified 4 warning signs for Kerlink (2 shouldn't be ignored) you should be aware of.
If strong companies turning a profit tickle your fancy, then you'll want to check out this free list of interesting companies that trade on a low P/E (but have proven they can grow earnings).
Valuation is complex, but we're here to simplify it.
Discover if Kerlink might be undervalued or overvalued with our detailed analysis, featuring fair value estimates, potential risks, dividends, insider trades, and its financial condition.
Access Free AnalysisHave feedback on this article? Concerned about the content? Get in touch with us directly. Alternatively, email editorial-team (at) simplywallst.com.
This article by Simply Wall St is general in nature. We provide commentary based on historical data and analyst forecasts only using an unbiased methodology and our articles are not intended to be financial advice. It does not constitute a recommendation to buy or sell any stock, and does not take account of your objectives, or your financial situation. We aim to bring you long-term focused analysis driven by fundamental data. Note that our analysis may not factor in the latest price-sensitive company announcements or qualitative material. Simply Wall St has no position in any stocks mentioned.
About ENXTPA:ALKLK
Kerlink
Provides network infrastructure solutions for the Internet of Things (IoT) market to historical and alternative operators, businesses, and utilities in Europe, the Middle East, Africa, the Asia-Pacific, and the Americas.
High growth potential with adequate balance sheet.
Market Insights

Advertisement
Community Narratives
MicroVision will explode future revenue by 380.37% with a vision towards success
Fair Value US$60|98.4% undervalued
TH
Community Contributor
The Indispensable Artery for a New North American Economy
Fair Value CA$132.87|0.7% overvalued
TI
Community Contributor
Recently Updated Narratives
CE

cementafriend on Constellation Energy ·
Constellation Energy Dividends and Growth
Fair Value:US$348.054.7% overvalued
2 followersusers have followed this narrative
0 commentsusers have commented on this narrative
0 likesusers have liked this narrative
KH

Khagani on CoreWeave ·
CoreWeave's Revenue Expected to Rocket 77.88% in 5-Year Forecast
Fair Value:US$11033.5% undervalued
1 followerusers have followed this narrative
0 commentsusers have commented on this narrative
0 likesusers have liked this narrative
PO

PortfolioPlus on Bisalloy Steel Group ·
Bisalloy Steel Group will shine with a projected profit margin increase of 12.8%
Fair Value:AU$6.7118.0% undervalued
2 followersusers have followed this narrative
0 commentsusers have commented on this narrative
0 likesusers have liked this narrative
Popular Narratives
TH

TheWallstreetKing on MicroVision ·
MicroVision will explode future revenue by 380.37% with a vision towards success
Fair Value:US$6098.4% undervalued
101 followersusers have followed this narrative
10 commentsusers have commented on this narrative
20 likesusers have liked this narrative
AN


AnalystConsensusTarget on NVIDIA ·
NVDA: Expanding AI Demand Will Drive Major Data Center Investments Through 2026
Fair Value:US$250.3929.3% undervalued
935 followersusers have followed this narrative
6 commentsusers have commented on this narrative
23 likesusers have liked this narrative
OS


oscargarcia on Alphabet ·
The company that turned a verb into a global necessity and basically runs the modern internet, digital ads, smartphones, maps, and AI.
Fair Value:US$3405.8% undervalued
140 followersusers have followed this narrative
6 commentsusers have commented on this narrative
18 likesusers have liked this narrative