
Advertisement
- France
- /
- Specialty Stores
- /
- ENXTPA:ARAMI
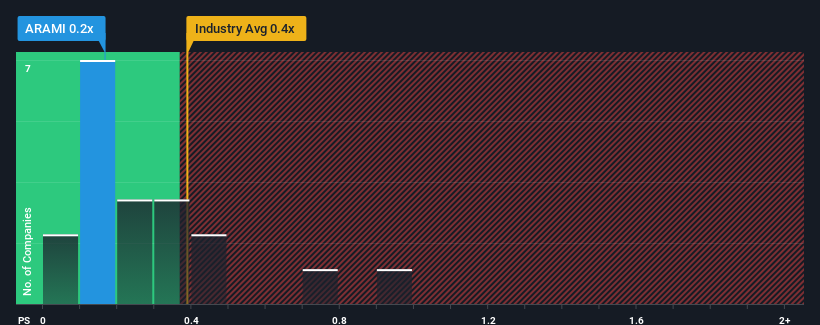
Investors Aren't Entirely Convinced By Aramis Group SAS' (EPA:ARAMI) Revenues
It's not a stretch to say that Aramis Group SAS' (EPA:ARAMI) price-to-sales (or "P/S") ratio of 0.2x seems quite "middle-of-the-road" for Specialty Retail companies in France, seeing as it matches the P/S ratio of the wider industry. Although, it's not wise to simply ignore the P/S without explanation as investors may be disregarding a distinct opportunity or a costly mistake.
View our latest analysis for Aramis Group SAS
How Aramis Group SAS Has Been Performing
Recent times have been advantageous for Aramis Group SAS as its revenues have been rising faster than most other companies. It might be that many expect the strong revenue performance to wane, which has kept the P/S ratio from rising. If you like the company, you'd be hoping this isn't the case so that you could potentially pick up some stock while it's not quite in favour.
Want the full picture on analyst estimates for the company? Then our free report on Aramis Group SAS will help you uncover what's on the horizon.How Is Aramis Group SAS' Revenue Growth Trending?
In order to justify its P/S ratio, Aramis Group SAS would need to produce growth that's similar to the industry.
If we review the last year of revenue growth, the company posted a worthy increase of 9.9%. This was backed up an excellent period prior to see revenue up by 134% in total over the last three years. So we can start by confirming that the company has done a great job of growing revenues over that time.
Shifting to the future, estimates from the four analysts covering the company suggest revenue should grow by 12% per annum over the next three years. Meanwhile, the rest of the industry is forecast to only expand by 6.6% per year, which is noticeably less attractive.
With this in consideration, we find it intriguing that Aramis Group SAS' P/S is closely matching its industry peers. Apparently some shareholders are skeptical of the forecasts and have been accepting lower selling prices.
What Does Aramis Group SAS' P/S Mean For Investors?
Typically, we'd caution against reading too much into price-to-sales ratios when settling on investment decisions, though it can reveal plenty about what other market participants think about the company.
We've established that Aramis Group SAS currently trades on a lower than expected P/S since its forecasted revenue growth is higher than the wider industry. Perhaps uncertainty in the revenue forecasts are what's keeping the P/S ratio consistent with the rest of the industry. At least the risk of a price drop looks to be subdued, but investors seem to think future revenue could see some volatility.
Many other vital risk factors can be found on the company's balance sheet. Our free balance sheet analysis for Aramis Group SAS with six simple checks will allow you to discover any risks that could be an issue.
If strong companies turning a profit tickle your fancy, then you'll want to check out this free list of interesting companies that trade on a low P/E (but have proven they can grow earnings).
New: Manage All Your Stock Portfolios in One Place
We've created the ultimate portfolio companion for stock investors, and it's free.
• Connect an unlimited number of Portfolios and see your total in one currency
• Be alerted to new Warning Signs or Risks via email or mobile
• Track the Fair Value of your stocks
Have feedback on this article? Concerned about the content? Get in touch with us directly. Alternatively, email editorial-team (at) simplywallst.com.
This article by Simply Wall St is general in nature. We provide commentary based on historical data and analyst forecasts only using an unbiased methodology and our articles are not intended to be financial advice. It does not constitute a recommendation to buy or sell any stock, and does not take account of your objectives, or your financial situation. We aim to bring you long-term focused analysis driven by fundamental data. Note that our analysis may not factor in the latest price-sensitive company announcements or qualitative material. Simply Wall St has no position in any stocks mentioned.
About ENXTPA:ARAMI
Aramis Group SAS
Engages in the online sale of used vehicles in France, Belgium, the United Kingdom, Austria, Italy, and Spain.
Flawless balance sheet and undervalued.
Similar Companies
Market Insights

Advertisement
Community Narratives
MINISO's fair value is projected at 26.69 with an anticipated PE ratio shift of 20x
Fair Value US$24.03|11.0% undervalued
BE
Community Contributor
Procter & Gamble: A Dividend Giant Facing Slowing Growth
Fair Value US$119.81|23.3% overvalued
AN
Community Contributor
Eli Lilly's Future Growth Driven by Tirzepatide and Favorable Market Conditions
Fair Value US$1.19k|13.8% undervalued
EA
Community Contributor