If You Had Bought Patrimoine et Commerce's (EPA:PAT) Shares Three Years Ago You Would Be Down 30%


Many investors define successful investing as beating the market average over the long term. But its virtually certain that sometimes you will buy stocks that fall short of the market average returns. Unfortunately, that's been the case for longer term Patrimoine et Commerce SA (EPA:PAT) shareholders, since the share price is down 30% in the last three years, falling well short of the market return of around 24%.
Check out our latest analysis for Patrimoine et Commerce
While markets are a powerful pricing mechanism, share prices reflect investor sentiment, not just underlying business performance. By comparing earnings per share (EPS) and share price changes over time, we can get a feel for how investor attitudes to a company have morphed over time.
Patrimoine et Commerce saw its EPS decline at a compound rate of 12% per year, over the last three years. This fall in EPS isn't far from the rate of share price decline, which was 11% per year. So it seems like sentiment towards the stock hasn't changed all that much over time. In this case, it seems that the EPS is guiding the share price.
The company's earnings per share (over time) is depicted in the image below (click to see the exact numbers).
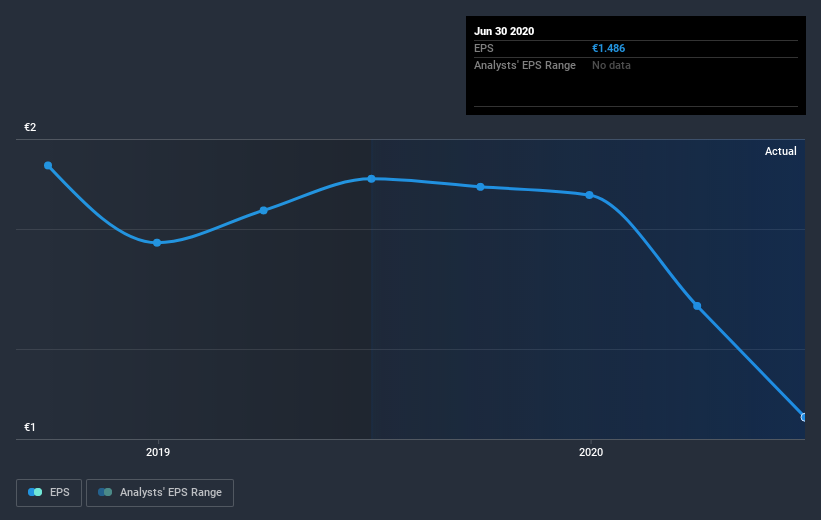
Dive deeper into Patrimoine et Commerce's key metrics by checking this interactive graph of Patrimoine et Commerce's earnings, revenue and cash flow.
What About Dividends?
As well as measuring the share price return, investors should also consider the total shareholder return (TSR). Whereas the share price return only reflects the change in the share price, the TSR includes the value of dividends (assuming they were reinvested) and the benefit of any discounted capital raising or spin-off. So for companies that pay a generous dividend, the TSR is often a lot higher than the share price return. We note that for Patrimoine et Commerce the TSR over the last 3 years was -14%, which is better than the share price return mentioned above. The dividends paid by the company have thusly boosted the total shareholder return.
A Different Perspective
Investors in Patrimoine et Commerce had a tough year, with a total loss of 18% (including dividends), against a market gain of about 0.3%. However, keep in mind that even the best stocks will sometimes underperform the market over a twelve month period. Regrettably, last year's performance caps off a bad run, with the shareholders facing a total loss of 0.1% per year over five years. We realise that Baron Rothschild has said investors should "buy when there is blood on the streets", but we caution that investors should first be sure they are buying a high quality business. It's always interesting to track share price performance over the longer term. But to understand Patrimoine et Commerce better, we need to consider many other factors. To that end, you should learn about the 3 warning signs we've spotted with Patrimoine et Commerce (including 1 which is concerning) .
We will like Patrimoine et Commerce better if we see some big insider buys. While we wait, check out this free list of growing companies with considerable, recent, insider buying.
Please note, the market returns quoted in this article reflect the market weighted average returns of stocks that currently trade on FR exchanges.
If you’re looking to trade Patrimoine et Commerce, open an account with the lowest-cost* platform trusted by professionals, Interactive Brokers. Their clients from over 200 countries and territories trade stocks, options, futures, forex, bonds and funds worldwide from a single integrated account. Promoted
If you're looking to trade Patrimoine et Commerce, open an account with the lowest-cost platform trusted by professionals, Interactive Brokers.
With clients in over 200 countries and territories, and access to 160 markets, IBKR lets you trade stocks, options, futures, forex, bonds and funds from a single integrated account.
Enjoy no hidden fees, no account minimums, and FX conversion rates as low as 0.03%, far better than what most brokers offer.
Sponsored ContentNew: Manage All Your Stock Portfolios in One Place
We've created the ultimate portfolio companion for stock investors, and it's free.
• Connect an unlimited number of Portfolios and see your total in one currency
• Be alerted to new Warning Signs or Risks via email or mobile
• Track the Fair Value of your stocks
This article by Simply Wall St is general in nature. It does not constitute a recommendation to buy or sell any stock, and does not take account of your objectives, or your financial situation. We aim to bring you long-term focused analysis driven by fundamental data. Note that our analysis may not factor in the latest price-sensitive company announcements or qualitative material. Simply Wall St has no position in any stocks mentioned.
*Interactive Brokers Rated Lowest Cost Broker by StockBrokers.com Annual Online Review 2020
Have feedback on this article? Concerned about the content? Get in touch with us directly. Alternatively, email editorial-team (at) simplywallst.com.
About ENXTPA:PAT
Patrimoine et Commerce
A real estate company, engages in the acquisition, development, and operation of commercial real estate properties in France.
6 star dividend payer with solid track record.
Similar Companies
Market Insights

Community Narratives

