Advertisement
Does Sanofi’s Recent Share Price Jump Signal More Room to Run in 2025?

Simply Wall St
Reviewed by Bailey Pemberton
If you are trying to figure out what to do with Sanofi stock, you are not alone. Investors are weighing their options as Sanofi's share price has been anything but dull lately. In just the last week, the stock has gained 3.7%, adding to an impressive 8.8% jump over the past month. While those short-term moves have caught attention, many still remember that Sanofi is down 8.4% year-to-date and off 10.5% over the last year. Yet, if you zoom out, the picture gets brighter. Over three and five years, the stock has delivered total returns of 19.5% and 27.0%.
Much of this long-term strength has been fueled by Sanofi’s ongoing innovation in healthcare, coupled with shifts in broader market sentiment around the pharmaceutical industry. As drug pricing scrutiny has eased a bit and investors have searched for defensive sectors, companies like Sanofi have started to look a lot more appealing on a risk-adjusted basis. Still, recent volatility has left some wondering if the shares are undervalued or if the risks remain too high.
That brings us to one of the most striking features about Sanofi right now: its valuation score. Using a rigorous 6-check system to assess how cheap or expensive the stock really is, Sanofi scores a perfect 6 out of 6 for being undervalued. That is no small feat, and it sets up a deeper dive into how the company fares across different valuation approaches. But even these tools might miss the bigger picture, and later in the article, we will explore a next-level method for sizing up what Sanofi’s really worth.
Why Sanofi is lagging behind its peers
Approach 1: Sanofi Discounted Cash Flow (DCF) Analysis
The Discounted Cash Flow (DCF) model estimates a company's value by projecting its future cash flows and discounting those amounts back to today's value. This approach helps determine what Sanofi should be worth based on the money it is expected to generate over time.
Currently, Sanofi generates €8.17 billion in Free Cash Flow. Over time, analysts expect this figure to rise, with future projections indicating Free Cash Flow reaching approximately €9.37 billion by 2029. The near-term cash flow figures are based on analyst estimates and gradually increase year after year. Beyond that, Simply Wall St extrapolates growth for further years to complete the valuation.
Using all these projections and discounting them to their present value, the DCF model assigns Sanofi an intrinsic fair value of €179.63 per share. Compared to the current market price, this calculation suggests the stock is trading at a 51.9% discount, indicating it is significantly undervalued by this measure.
Result: UNDERVALUED
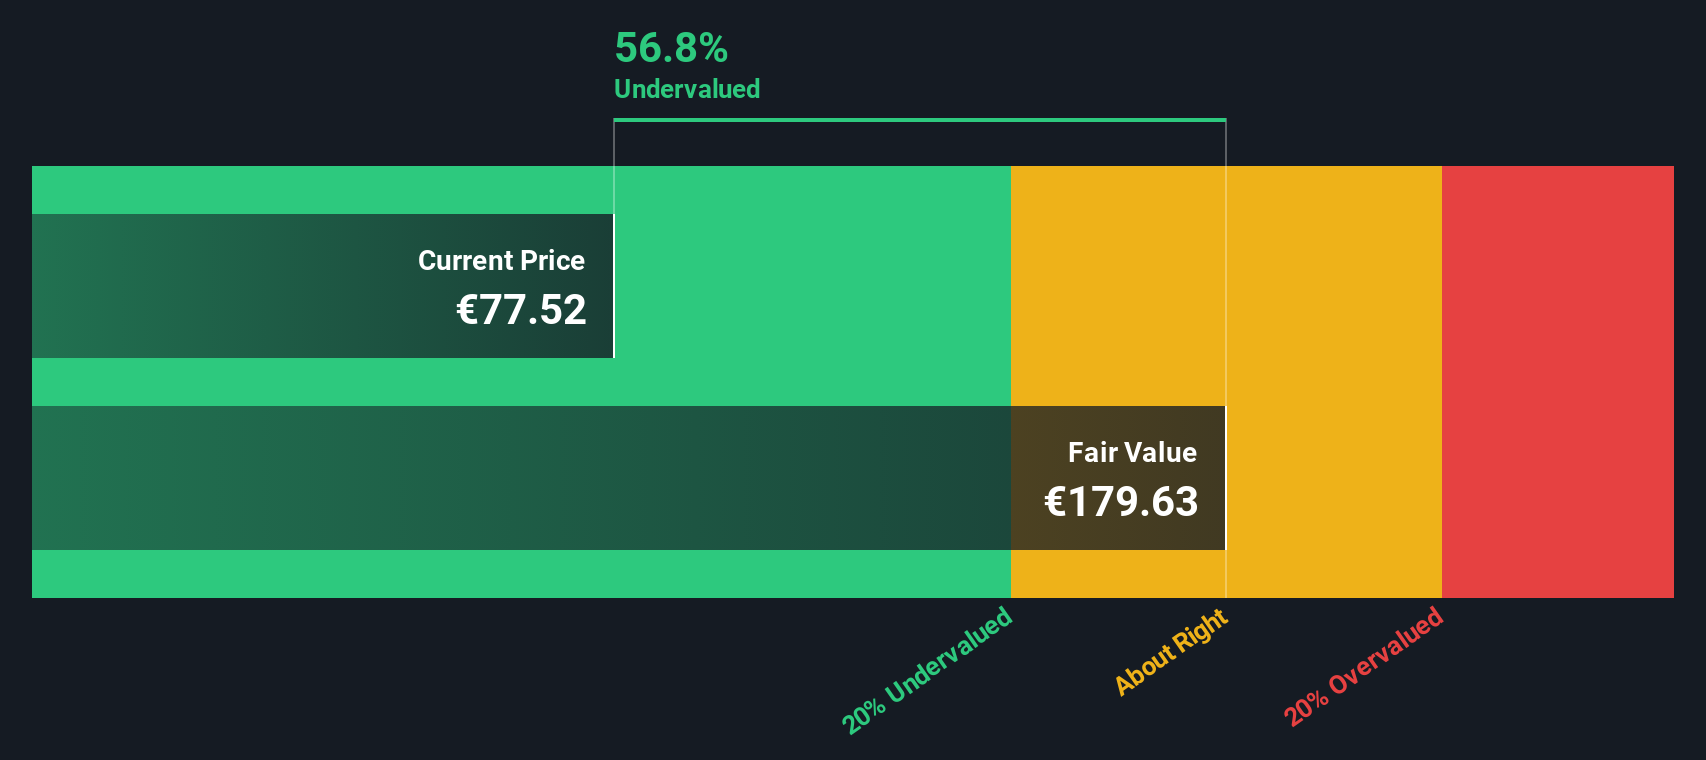
Our Discounted Cash Flow (DCF) analysis suggests Sanofi is undervalued by 51.9%. Track this in your watchlist or portfolio, or discover more undervalued stocks.
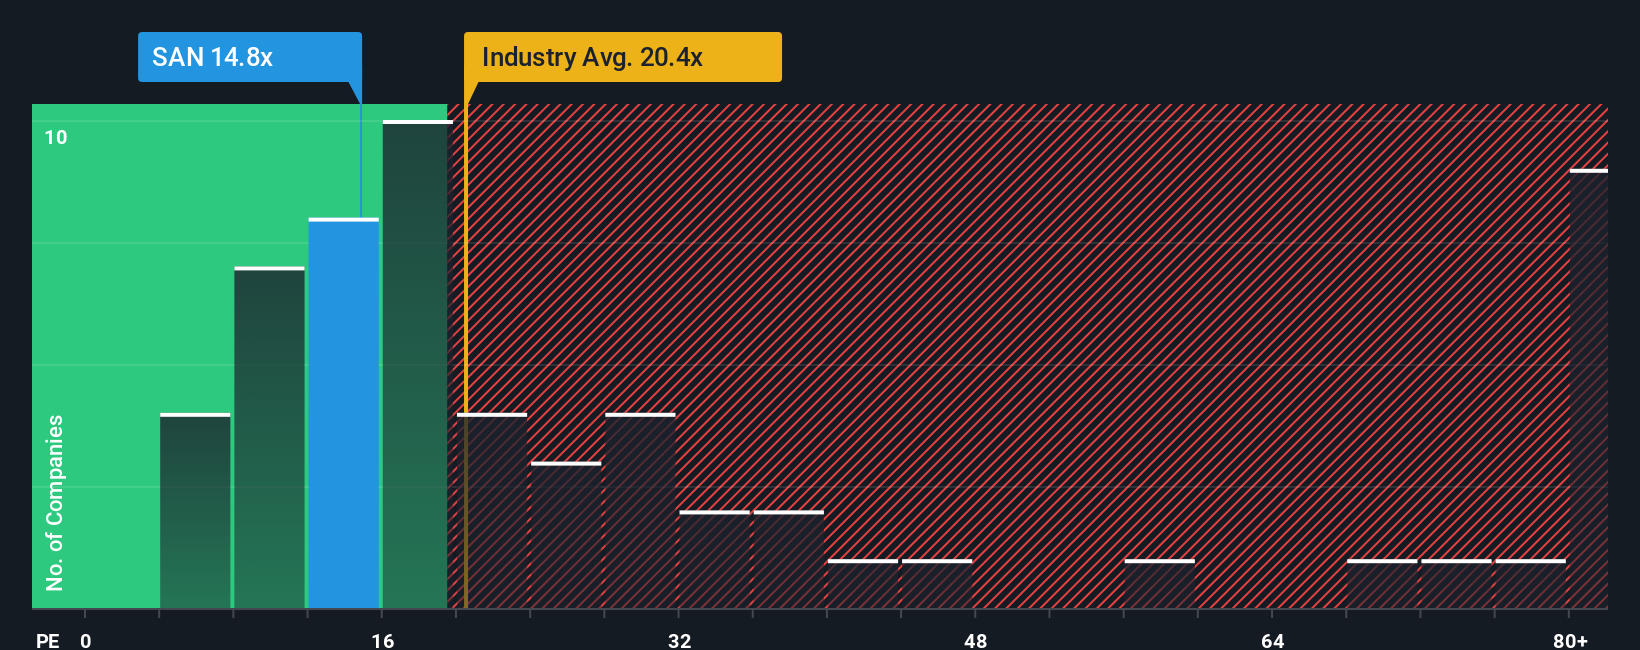
Approach 2: Sanofi Price vs Earnings
The Price-to-Earnings (PE) ratio is a widely used metric for valuing profitable companies, as it measures how much investors are willing to pay for each euro of a company's earnings. For businesses generating consistent profits like Sanofi, the PE ratio provides a direct snapshot of investor expectations and market sentiment.
What is considered a "fair" PE ratio depends heavily on factors such as how fast a company is expected to grow, its risk profile, and the overall stability of its earnings. Companies with higher growth prospects or lower perceived risks often command higher PE ratios, while slower-growing or riskier firms may trade at lower multiples.
Sanofi currently trades at a PE ratio of 16.5x, which stands out compared to the Pharmaceuticals industry average of 24.5x and a peer average of 20.5x. On the surface, this suggests Sanofi is trading at a discount. However, Simply Wall St goes a step further by calculating a "Fair Ratio," a data-driven benchmark that considers factors like Sanofi’s earnings growth, industry position, profit margins, market cap, and risk. For Sanofi, the Fair Ratio is 22.1x. This tailored approach provides more insight than simple peer or industry averages because it reflects the company’s unique qualities and prospects.
With the actual PE ratio at 16.5x and the Fair Ratio at 22.1x, Sanofi appears to be undervalued based on this preferred multiple approach.
Result: UNDERVALUED
PE ratios tell one story, but what if the real opportunity lies elsewhere? Discover companies where insiders are betting big on explosive growth.
Upgrade Your Decision Making: Choose your Sanofi Narrative
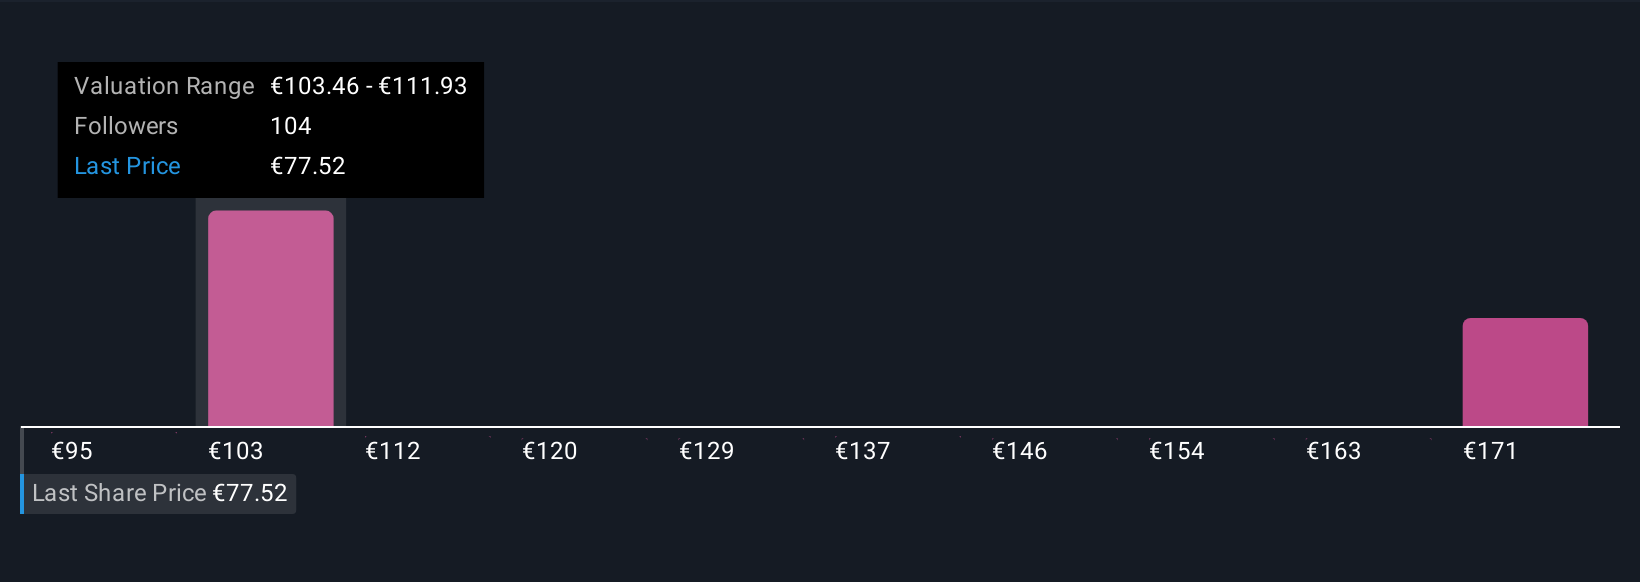
Earlier we mentioned that there is an even better way to understand valuation, so let’s introduce you to Narratives. A Narrative is a simple, powerful investment tool that lets you connect your own story or perspective on a company to actual financial forecasts and a fair value estimate. This approach moves beyond just numbers on a screen. Narratives make it easy to lay out your assumptions about Sanofi’s future growth, margins, and risk, describe how they fit together, and immediately see what that means for fair value right on the Simply Wall St Community page, used by millions of investors.
With Narratives, you decide when to buy or sell by comparing your estimated Fair Value to the current share price, and each Narrative automatically updates if new news or results change your assumptions. For example, one Sanofi Narrative expects sustained growth from the pipeline and new launches, forecasting 2028 earnings of €9.6 billion, higher profit margins, and a fair value above €124.8. In contrast, a more cautious Narrative assumes pipeline setbacks and pricing headwinds will sap profit growth, resulting in just €8.2 billion in earnings and a fair value closer to €92.0. Narratives put the drivers that matter most to you front and center, so you can make investing decisions grounded in both your view of the story and the latest numbers.
Do you think there's more to the story for Sanofi? Create your own Narrative to let the Community know!
This article by Simply Wall St is general in nature. We provide commentary based on historical data and analyst forecasts only using an unbiased methodology and our articles are not intended to be financial advice. It does not constitute a recommendation to buy or sell any stock, and does not take account of your objectives, or your financial situation. We aim to bring you long-term focused analysis driven by fundamental data. Note that our analysis may not factor in the latest price-sensitive company announcements or qualitative material. Simply Wall St has no position in any stocks mentioned.
New: Manage All Your Stock Portfolios in One Place
We've created the ultimate portfolio companion for stock investors, and it's free.
• Connect an unlimited number of Portfolios and see your total in one currency
• Be alerted to new Warning Signs or Risks via email or mobile
• Track the Fair Value of your stocks
Have feedback on this article? Concerned about the content? Get in touch with us directly. Alternatively, email editorial-team@simplywallst.com
About ENXTPA:SAN
Sanofi
Engages in the research, development, manufacture, and marketing of therapeutic solutions.
Very undervalued with flawless balance sheet and pays a dividend.
Similar Companies
Market Insights

Advertisement
Community Narratives
Kodiak AI - a potential 100 bagger opportunity?
Fair Value US$14.00|44.7% undervalued
DA
Community Contributor
A Fair Price for a Great Business Facing Real Threats
Fair Value US$383.06|13.0% undervalued
IM
Community Contributor
AXON And Shopify Integration Will Unlock Global Mobile Advertising
Fair Value US$646.30|0% overvalued
AN
Based on Analyst Price Targets