
Advertisement
Aelis Farma SA's (EPA:AELIS) 49% Dip Still Leaving Some Shareholders Feeling Restless Over Its P/SRatio
Aelis Farma SA (EPA:AELIS) shareholders that were waiting for something to happen have been dealt a blow with a 49% share price drop in the last month. For any long-term shareholders, the last month ends a year to forget by locking in a 57% share price decline.
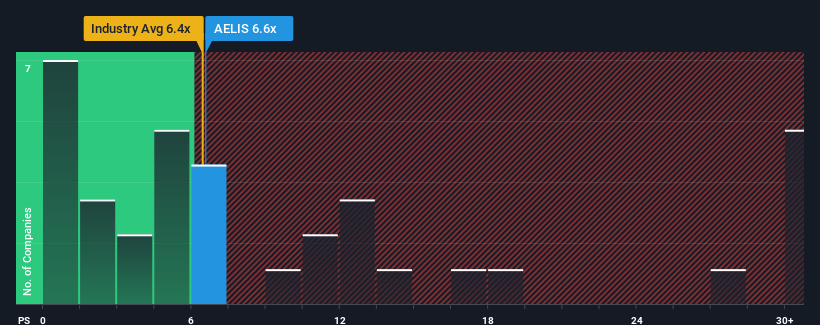
Although its price has dipped substantially, it's still not a stretch to say that Aelis Farma's price-to-sales (or "P/S") ratio of 6.6x right now seems quite "middle-of-the-road" compared to the Biotechs industry in France, where the median P/S ratio is around 6.4x. While this might not raise any eyebrows, if the P/S ratio is not justified investors could be missing out on a potential opportunity or ignoring looming disappointment.
View our latest analysis for Aelis Farma
How Has Aelis Farma Performed Recently?
With its revenue growth in positive territory compared to the declining revenue of most other companies, Aelis Farma has been doing quite well of late. Perhaps the market is expecting its current strong performance to taper off in accordance to the rest of the industry, which has kept the P/S contained. Those who are bullish on Aelis Farma will be hoping that this isn't the case, so that they can pick up the stock at a slightly lower valuation.
Want the full picture on analyst estimates for the company? Then our free report on Aelis Farma will help you uncover what's on the horizon.Do Revenue Forecasts Match The P/S Ratio?
There's an inherent assumption that a company should be matching the industry for P/S ratios like Aelis Farma's to be considered reasonable.
If we review the last year of revenue growth, the company posted a terrific increase of 48%. The latest three year period has also seen an incredible overall rise in revenue, aided by its incredible short-term performance. Accordingly, shareholders would have been over the moon with those medium-term rates of revenue growth.
Shifting to the future, estimates from the three analysts covering the company suggest revenue growth is heading into negative territory, declining 27% each year over the next three years. With the industry predicted to deliver 37% growth per year, that's a disappointing outcome.
With this in consideration, we think it doesn't make sense that Aelis Farma's P/S is closely matching its industry peers. Apparently many investors in the company reject the analyst cohort's pessimism and aren't willing to let go of their stock right now. There's a good chance these shareholders are setting themselves up for future disappointment if the P/S falls to levels more in line with the negative growth outlook.
The Bottom Line On Aelis Farma's P/S
Following Aelis Farma's share price tumble, its P/S is just clinging on to the industry median P/S. Using the price-to-sales ratio alone to determine if you should sell your stock isn't sensible, however it can be a practical guide to the company's future prospects.
Our check of Aelis Farma's analyst forecasts revealed that its outlook for shrinking revenue isn't bringing down its P/S as much as we would have predicted. With this in mind, we don't feel the current P/S is justified as declining revenues are unlikely to support a more positive sentiment for long. If the declining revenues were to materialize in the form of a declining share price, shareholders will be feeling the pinch.
We don't want to rain on the parade too much, but we did also find 3 warning signs for Aelis Farma (1 makes us a bit uncomfortable!) that you need to be mindful of.
Of course, profitable companies with a history of great earnings growth are generally safer bets. So you may wish to see this free collection of other companies that have reasonable P/E ratios and have grown earnings strongly.
New: Manage All Your Stock Portfolios in One Place
We've created the ultimate portfolio companion for stock investors, and it's free.
• Connect an unlimited number of Portfolios and see your total in one currency
• Be alerted to new Warning Signs or Risks via email or mobile
• Track the Fair Value of your stocks
Have feedback on this article? Concerned about the content? Get in touch with us directly. Alternatively, email editorial-team (at) simplywallst.com.
This article by Simply Wall St is general in nature. We provide commentary based on historical data and analyst forecasts only using an unbiased methodology and our articles are not intended to be financial advice. It does not constitute a recommendation to buy or sell any stock, and does not take account of your objectives, or your financial situation. We aim to bring you long-term focused analysis driven by fundamental data. Note that our analysis may not factor in the latest price-sensitive company announcements or qualitative material. Simply Wall St has no position in any stocks mentioned.
About ENXTPA:AELIS
Aelis Farma
A clinical-stage biopharmaceutical company, focuses on discovering and developing drug candidates for the treatment of central nervous system disorders in France.
Flawless balance sheet with high growth potential.
Market Insights

Advertisement
Community Narratives
The Next Phase of Energy Storage: How NeoVolta Is Tackling America’s Power Crunch
Fair Value US$7.50|35.1% undervalued
MA
Community Contributor
Why EnSilica is Worth Possibly 13x its Current Price
Fair Value UK£5.00|89.8% undervalued
DO
Community Contributor
M&A Activity, Industry Diversification & A Defense Contract Monopoly Will Push BWXT For Healthy Long-Term Growth
Fair Value US$220.00|15.2% undervalued
CL
Community Contributor
A case for Cassiar Gold Corp (TSXV: GLDC) to reach CAD$8-10 before 2030 (X30-37)
Fair Value CA$10.00|96.0% undervalued
AG
Community Contributor