
Advertisement
Does Eutelsat Communications S.A.'s (EPA:ETL) P/E Ratio Signal A Buying Opportunity?

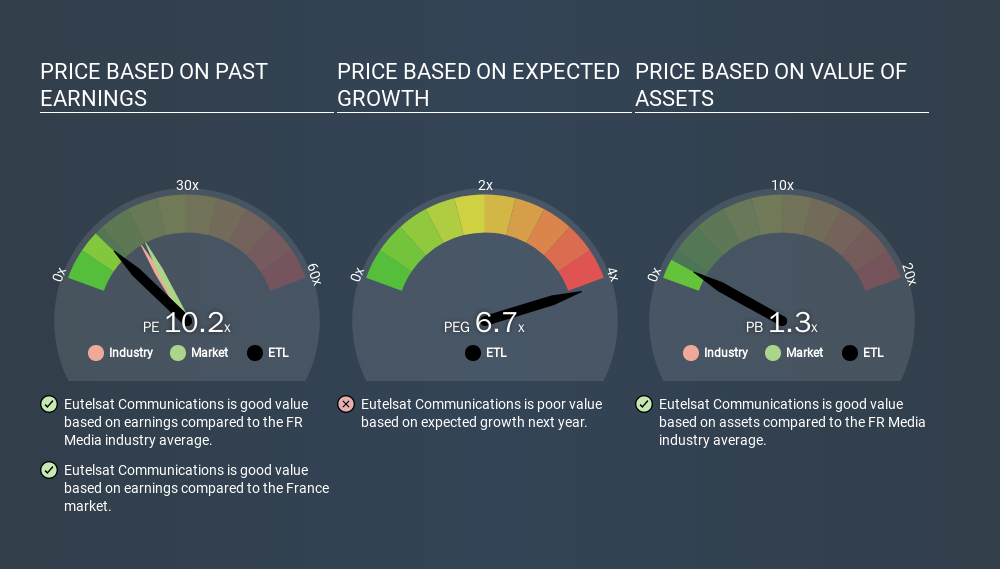
This article is written for those who want to get better at using price to earnings ratios (P/E ratios). We'll look at Eutelsat Communications S.A.'s (EPA:ETL) P/E ratio and reflect on what it tells us about the company's share price. Looking at earnings over the last twelve months, Eutelsat Communications has a P/E ratio of 10.19. In other words, at today's prices, investors are paying €10.19 for every €1 in prior year profit.
See our latest analysis for Eutelsat Communications
How Do You Calculate A P/E Ratio?
The formula for price to earnings is:
Price to Earnings Ratio = Share Price ÷ Earnings per Share (EPS)
Or for Eutelsat Communications:
P/E of 10.19 = €14.92 ÷ €1.46 (Based on the year to June 2019.)
Is A High Price-to-Earnings Ratio Good?
A higher P/E ratio means that investors are paying a higher price for each €1 of company earnings. That is not a good or a bad thing per se, but a high P/E does imply buyers are optimistic about the future.
Does Eutelsat Communications Have A Relatively High Or Low P/E For Its Industry?
The P/E ratio indicates whether the market has higher or lower expectations of a company. We can see in the image below that the average P/E (17.1) for companies in the media industry is higher than Eutelsat Communications's P/E.
This suggests that market participants think Eutelsat Communications will underperform other companies in its industry. While current expectations are low, the stock could be undervalued if the situation is better than the market assumes. You should delve deeper. I like to check if company insiders have been buying or selling.
How Growth Rates Impact P/E Ratios
Companies that shrink earnings per share quickly will rapidly decrease the 'E' in the equation. That means unless the share price falls, the P/E will increase in a few years. So while a stock may look cheap based on past earnings, it could be expensive based on future earnings.
Most would be impressed by Eutelsat Communications earnings growth of 17% in the last year. And earnings per share have improved by 1.2% annually, over the last five years. So one might expect an above average P/E ratio. In contrast, EPS has decreased by 1.2%, annually, over 3 years.
Remember: P/E Ratios Don't Consider The Balance Sheet
Don't forget that the P/E ratio considers market capitalization. That means it doesn't take debt or cash into account. The exact same company would hypothetically deserve a higher P/E ratio if it had a strong balance sheet, than if it had a weak one with lots of debt, because a cashed up company can spend on growth.
Such expenditure might be good or bad, in the long term, but the point here is that the balance sheet is not reflected by this ratio.
So What Does Eutelsat Communications's Balance Sheet Tell Us?
Eutelsat Communications's net debt is 67% of its market cap. This is enough debt that you'd have to make some adjustments before using the P/E ratio to compare it to a company with net cash.
The Verdict On Eutelsat Communications's P/E Ratio
Eutelsat Communications trades on a P/E ratio of 10.2, which is below the FR market average of 18.1. The company may have significant debt, but EPS growth was good last year. The low P/E ratio suggests current market expectations are muted, implying these levels of growth will not continue.
Investors have an opportunity when market expectations about a stock are wrong. If it is underestimating a company, investors can make money by buying and holding the shares until the market corrects itself. So this free report on the analyst consensus forecasts could help you make a master move on this stock.
Of course you might be able to find a better stock than Eutelsat Communications. So you may wish to see this free collection of other companies that have grown earnings strongly.
If you spot an error that warrants correction, please contact the editor at editorial-team@simplywallst.com. This article by Simply Wall St is general in nature. It does not constitute a recommendation to buy or sell any stock, and does not take account of your objectives, or your financial situation. Simply Wall St has no position in the stocks mentioned.
We aim to bring you long-term focused research analysis driven by fundamental data. Note that our analysis may not factor in the latest price-sensitive company announcements or qualitative material. Thank you for reading.
About ENXTPA:ETL
Fair value with imperfect balance sheet.
Similar Companies
Market Insights

Advertisement
Community Narratives
MicroStrategy: Volatile Gamble or Golden Opportunity?
Fair Value US$663.00|31.9% undervalued
BL
Community Contributor
Emerging Markets and Debt Reduction Will Propel Bath & Body Works Forward
Fair Value US$40.73|22.1% undervalued
ZW
Community Contributor
An amazing opportunity to potentially get a 100 bagger
Fair Value US$10.00|36.0% overvalued
DA
Community Contributor