
Advertisement
Further Upside For Invibes Advertising N.V. (EPA:ALINV) Shares Could Introduce Price Risks After 27% Bounce
Despite an already strong run, Invibes Advertising N.V. (EPA:ALINV) shares have been powering on, with a gain of 27% in the last thirty days. Not all shareholders will be feeling jubilant, since the share price is still down a very disappointing 17% in the last twelve months.
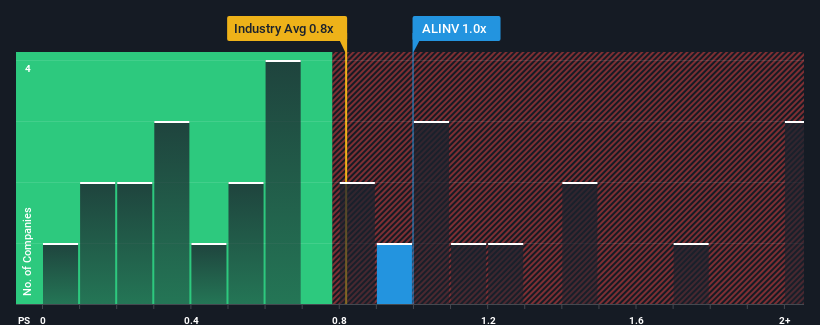
Even after such a large jump in price, it's still not a stretch to say that Invibes Advertising's price-to-sales (or "P/S") ratio of 1x right now seems quite "middle-of-the-road" compared to the Media industry in France, where the median P/S ratio is around 0.8x. While this might not raise any eyebrows, if the P/S ratio is not justified investors could be missing out on a potential opportunity or ignoring looming disappointment.
See our latest analysis for Invibes Advertising
What Does Invibes Advertising's P/S Mean For Shareholders?
Invibes Advertising hasn't been tracking well recently as its declining revenue compares poorly to other companies, which have seen some growth in their revenues on average. Perhaps the market is expecting its poor revenue performance to improve, keeping the P/S from dropping. If not, then existing shareholders may be a little nervous about the viability of the share price.
Want the full picture on analyst estimates for the company? Then our free report on Invibes Advertising will help you uncover what's on the horizon.Is There Some Revenue Growth Forecasted For Invibes Advertising?
There's an inherent assumption that a company should be matching the industry for P/S ratios like Invibes Advertising's to be considered reasonable.
Taking a look back first, the company's revenue growth last year wasn't something to get excited about as it posted a disappointing decline of 2.2%. Even so, admirably revenue has lifted 178% in aggregate from three years ago, notwithstanding the last 12 months. So we can start by confirming that the company has generally done a very good job of growing revenue over that time, even though it had some hiccups along the way.
Turning to the outlook, the next year should generate growth of 12% as estimated by the sole analyst watching the company. That's shaping up to be materially higher than the 7.8% growth forecast for the broader industry.
In light of this, it's curious that Invibes Advertising's P/S sits in line with the majority of other companies. It may be that most investors aren't convinced the company can achieve future growth expectations.
What Does Invibes Advertising's P/S Mean For Investors?
Invibes Advertising's stock has a lot of momentum behind it lately, which has brought its P/S level with the rest of the industry. It's argued the price-to-sales ratio is an inferior measure of value within certain industries, but it can be a powerful business sentiment indicator.
Despite enticing revenue growth figures that outpace the industry, Invibes Advertising's P/S isn't quite what we'd expect. Perhaps uncertainty in the revenue forecasts are what's keeping the P/S ratio consistent with the rest of the industry. It appears some are indeed anticipating revenue instability, because these conditions should normally provide a boost to the share price.
You should always think about risks. Case in point, we've spotted 3 warning signs for Invibes Advertising you should be aware of, and 1 of them doesn't sit too well with us.
It's important to make sure you look for a great company, not just the first idea you come across. So if growing profitability aligns with your idea of a great company, take a peek at this free list of interesting companies with strong recent earnings growth (and a low P/E).
New: AI Stock Screener & Alerts
Our new AI Stock Screener scans the market every day to uncover opportunities.
• Dividend Powerhouses (3%+ Yield)
• Undervalued Small Caps with Insider Buying
• High growth Tech and AI Companies
Or build your own from over 50 metrics.
Have feedback on this article? Concerned about the content? Get in touch with us directly. Alternatively, email editorial-team (at) simplywallst.com.
This article by Simply Wall St is general in nature. We provide commentary based on historical data and analyst forecasts only using an unbiased methodology and our articles are not intended to be financial advice. It does not constitute a recommendation to buy or sell any stock, and does not take account of your objectives, or your financial situation. We aim to bring you long-term focused analysis driven by fundamental data. Note that our analysis may not factor in the latest price-sensitive company announcements or qualitative material. Simply Wall St has no position in any stocks mentioned.
About ENXTPA:ALINV
Invibes Advertising
A technology company, provides digital advertising services in Belgium and internationally.
Flawless balance sheet with low risk.
Market Insights

Advertisement
Community Narratives
MINISO's fair value is projected at 26.69 with an anticipated PE ratio shift of 20x
Fair Value US$24.03|11.0% undervalued
BE
Community Contributor
Procter & Gamble: A Dividend Giant Facing Slowing Growth
Fair Value US$119.81|23.3% overvalued
AN
Community Contributor
Eli Lilly's Future Growth Driven by Tirzepatide and Favorable Market Conditions
Fair Value US$1.19k|13.8% undervalued
EA
Community Contributor