Stock Analysis
AXA SA's (EPA:CS) Fundamentals Look Pretty Strong: Could The Market Be Wrong About The Stock?


It is hard to get excited after looking at AXA's (EPA:CS) recent performance, when its stock has declined 10% over the past three months. However, stock prices are usually driven by a company’s financial performance over the long term, which in this case looks quite promising. Specifically, we decided to study AXA's ROE in this article.
Return on equity or ROE is an important factor to be considered by a shareholder because it tells them how effectively their capital is being reinvested. In simpler terms, it measures the profitability of a company in relation to shareholder's equity.
See our latest analysis for AXA
How To Calculate Return On Equity?
The formula for ROE is:
Return on Equity = Net Profit (from continuing operations) ÷ Shareholders' Equity
So, based on the above formula, the ROE for AXA is:
12% = €7.4b ÷ €60b (Based on the trailing twelve months to December 2023).
The 'return' refers to a company's earnings over the last year. That means that for every €1 worth of shareholders' equity, the company generated €0.12 in profit.
What Has ROE Got To Do With Earnings Growth?
So far, we've learned that ROE is a measure of a company's profitability. We now need to evaluate how much profit the company reinvests or "retains" for future growth which then gives us an idea about the growth potential of the company. Generally speaking, other things being equal, firms with a high return on equity and profit retention, have a higher growth rate than firms that don’t share these attributes.
A Side By Side comparison of AXA's Earnings Growth And 12% ROE
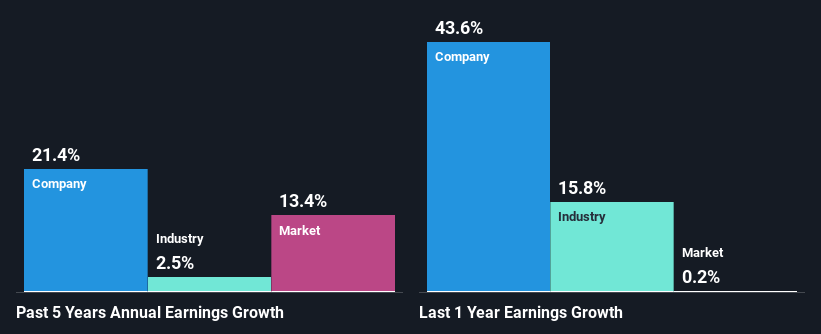
To start with, AXA's ROE looks acceptable. Even when compared to the industry average of 12% the company's ROE looks quite decent. This certainly adds some context to AXA's exceptional 21% net income growth seen over the past five years. We reckon that there could also be other factors at play here. Such as - high earnings retention or an efficient management in place.
We then compared AXA's net income growth with the industry and we're pleased to see that the company's growth figure is higher when compared with the industry which has a growth rate of 2.5% in the same 5-year period.
Earnings growth is a huge factor in stock valuation. The investor should try to establish if the expected growth or decline in earnings, whichever the case may be, is priced in. This then helps them determine if the stock is placed for a bright or bleak future. One good indicator of expected earnings growth is the P/E ratio which determines the price the market is willing to pay for a stock based on its earnings prospects. So, you may want to check if AXA is trading on a high P/E or a low P/E, relative to its industry.
Is AXA Efficiently Re-investing Its Profits?
AXA has a significant three-year median payout ratio of 60%, meaning the company only retains 40% of its income. This implies that the company has been able to achieve high earnings growth despite returning most of its profits to shareholders.
Additionally, AXA has paid dividends over a period of at least ten years which means that the company is pretty serious about sharing its profits with shareholders. Our latest analyst data shows that the future payout ratio of the company over the next three years is expected to be approximately 60%. Still, forecasts suggest that AXA's future ROE will rise to 16% even though the the company's payout ratio is not expected to change by much.
Summary
Overall, we are quite pleased with AXA's performance. We are particularly impressed by the considerable earnings growth posted by the company, which was likely backed by its high ROE. While the company is paying out most of its earnings as dividends, it has been able to grow its earnings in spite of it, so that's probably a good sign. That being so, a study of the latest analyst forecasts show that the company is expected to see a slowdown in its future earnings growth. To know more about the company's future earnings growth forecasts take a look at this free report on analyst forecasts for the company to find out more.
Valuation is complex, but we're helping make it simple.
Find out whether AXA is potentially over or undervalued by checking out our comprehensive analysis, which includes fair value estimates, risks and warnings, dividends, insider transactions and financial health.
View the Free AnalysisHave feedback on this article? Concerned about the content? Get in touch with us directly. Alternatively, email editorial-team (at) simplywallst.com.
This article by Simply Wall St is general in nature. We provide commentary based on historical data and analyst forecasts only using an unbiased methodology and our articles are not intended to be financial advice. It does not constitute a recommendation to buy or sell any stock, and does not take account of your objectives, or your financial situation. We aim to bring you long-term focused analysis driven by fundamental data. Note that our analysis may not factor in the latest price-sensitive company announcements or qualitative material. Simply Wall St has no position in any stocks mentioned.
Valuation is complex, but we're helping make it simple.
Find out whether AXA is potentially over or undervalued by checking out our comprehensive analysis, which includes fair value estimates, risks and warnings, dividends, insider transactions and financial health.
View the Free AnalysisHave feedback on this article? Concerned about the content? Get in touch with us directly. Alternatively, email editorial-team@simplywallst.com
About ENXTPA:CS
AXA
Through its subsidiaries, provides insurance, asset management, and banking services worldwide.
Undervalued with solid track record and pays a dividend.
