
Advertisement
- France
- /
- Medical Equipment
- /
- ENXTPA:AMPLI
Amplitude Surgical (EPA:AMPLI) shareholders are still up 100% over 5 years despite pulling back 16% in the past week

It's been a soft week for Amplitude Surgical SA (EPA:AMPLI) shares, which are down 16%. On the bright side the returns have been quite good over the last half decade. After all, the share price is up a market-beating 100% in that time.
In light of the stock dropping 16% in the past week, we want to investigate the longer term story, and see if fundamentals have been the driver of the company's positive five-year return.
View our latest analysis for Amplitude Surgical
Amplitude Surgical isn't currently profitable, so most analysts would look to revenue growth to get an idea of how fast the underlying business is growing. Shareholders of unprofitable companies usually desire strong revenue growth. That's because fast revenue growth can be easily extrapolated to forecast profits, often of considerable size.
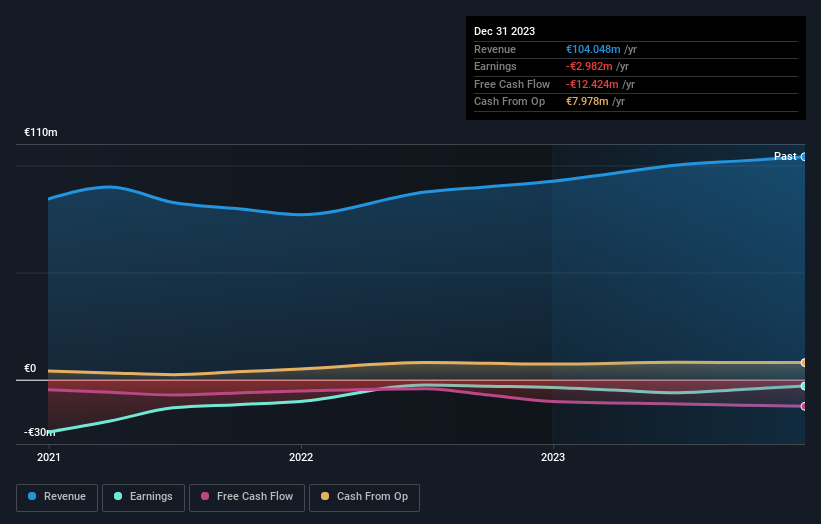
Over the last half decade Amplitude Surgical's revenue has actually been trending down at about 1.0% per year. Despite the lack of revenue growth, the stock has returned a respectable 15%, compound, over that time. To us that suggests that there probably isn't a lot of correlation between the past revenue performance and the share price, but a closer look at analyst forecasts and the bottom line may well explain a lot.
You can see how earnings and revenue have changed over time in the image below (click on the chart to see the exact values).
If you are thinking of buying or selling Amplitude Surgical stock, you should check out this FREE detailed report on its balance sheet.
A Different Perspective
While the broader market gained around 0.7% in the last year, Amplitude Surgical shareholders lost 18%. However, keep in mind that even the best stocks will sometimes underperform the market over a twelve month period. On the bright side, long term shareholders have made money, with a gain of 15% per year over half a decade. If the fundamental data continues to indicate long term sustainable growth, the current sell-off could be an opportunity worth considering. Shareholders might want to examine this detailed historical graph of past earnings, revenue and cash flow.
Of course, you might find a fantastic investment by looking elsewhere. So take a peek at this free list of companies we expect will grow earnings.
Please note, the market returns quoted in this article reflect the market weighted average returns of stocks that currently trade on French exchanges.
New: Manage All Your Stock Portfolios in One Place
We've created the ultimate portfolio companion for stock investors, and it's free.
• Connect an unlimited number of Portfolios and see your total in one currency
• Be alerted to new Warning Signs or Risks via email or mobile
• Track the Fair Value of your stocks
Have feedback on this article? Concerned about the content? Get in touch with us directly. Alternatively, email editorial-team (at) simplywallst.com.
This article by Simply Wall St is general in nature. We provide commentary based on historical data and analyst forecasts only using an unbiased methodology and our articles are not intended to be financial advice. It does not constitute a recommendation to buy or sell any stock, and does not take account of your objectives, or your financial situation. We aim to bring you long-term focused analysis driven by fundamental data. Note that our analysis may not factor in the latest price-sensitive company announcements or qualitative material. Simply Wall St has no position in any stocks mentioned.
Have feedback on this article? Concerned about the content? Get in touch with us directly. Alternatively, email editorial-team@simplywallst.com
About ENXTPA:AMPLI
Amplitude Surgical
Designs, develops, and markets products for orthopedic surgery in France and internationally.
Low and slightly overvalued.
Similar Companies
Market Insights

Advertisement
Community Narratives

BMW cruising ahead with new EVs and premium models to boost revenue 5%
Fair Value €135.07|45.0% undervalued
UN
Community Contributor
EU#2 - From Humble Beginnings to Global Powerhouse
Fair Value DKK 851.04|47.8% undervalued
TO
Community Contributor