
Advertisement
- France
- /
- Consumer Durables
- /
- ENXTPA:SK
Should You Be Tempted To Sell SEB SA (EPA:SK) Because Of Its P/E Ratio?
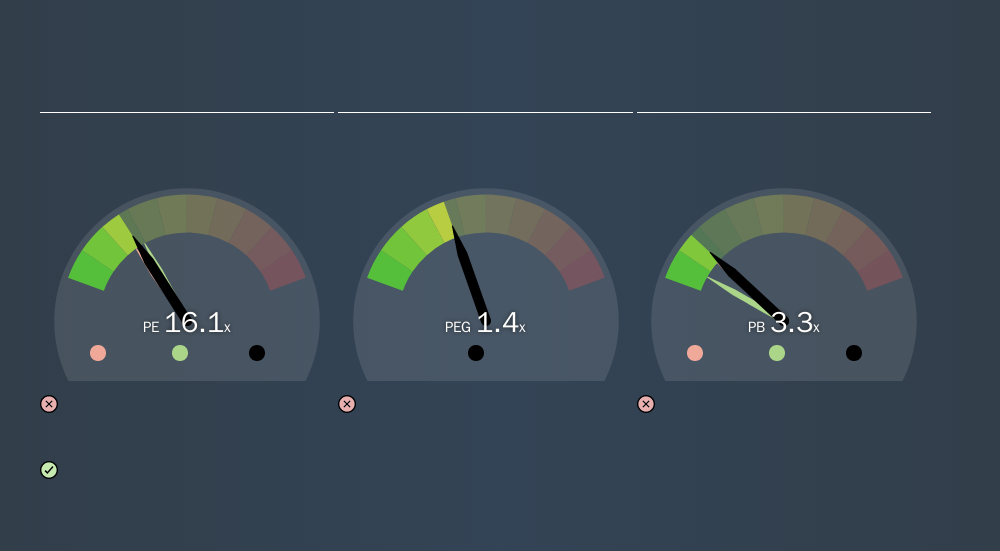
Today, we'll introduce the concept of the P/E ratio for those who are learning about investing. We'll show how you can use SEB SA's (EPA:SK) P/E ratio to inform your assessment of the investment opportunity. What is SEB's P/E ratio? Well, based on the last twelve months it is 16.07. That corresponds to an earnings yield of approximately 6.2%.
Check out our latest analysis for SEB
How Do I Calculate A Price To Earnings Ratio?
The formula for price to earnings is:
Price to Earnings Ratio = Price per Share ÷ Earnings per Share (EPS)
Or for SEB:
P/E of 16.07 = €138.50 ÷ €8.62 (Based on the year to June 2019.)
Is A High Price-to-Earnings Ratio Good?
The higher the P/E ratio, the higher the price tag of a business, relative to its trailing earnings. That is not a good or a bad thing per se, but a high P/E does imply buyers are optimistic about the future.
Does SEB Have A Relatively High Or Low P/E For Its Industry?
One good way to get a quick read on what market participants expect of a company is to look at its P/E ratio. You can see in the image below that the average P/E (14.8) for companies in the consumer durables industry is lower than SEB's P/E.
That means that the market expects SEB will outperform other companies in its industry.
How Growth Rates Impact P/E Ratios
Generally speaking the rate of earnings growth has a profound impact on a company's P/E multiple. That's because companies that grow earnings per share quickly will rapidly increase the 'E' in the equation. That means even if the current P/E is high, it will reduce over time if the share price stays flat. A lower P/E should indicate the stock is cheap relative to others -- and that may attract buyers.
It's great to see that SEB grew EPS by 12% in the last year. And earnings per share have improved by 20% annually, over the last five years. This could arguably justify a relatively high P/E ratio. The market might expect further growth, but it isn't guaranteed. So investors should always consider the P/E ratio alongside other factors, such as whether company directors have been buying shares.
A Limitation: P/E Ratios Ignore Debt and Cash In The Bank
One drawback of using a P/E ratio is that it considers market capitalization, but not the balance sheet. So it won't reflect the advantage of cash, or disadvantage of debt. In theory, a company can lower its future P/E ratio by using cash or debt to invest in growth.
Such spending might be good or bad, overall, but the key point here is that you need to look at debt to understand the P/E ratio in context.
SEB's Balance Sheet
SEB has net debt equal to 30% of its market cap. While it's worth keeping this in mind, it isn't a worry.
The Bottom Line On SEB's P/E Ratio
SEB's P/E is 16.1 which is below average (17.9) in the FR market. The company does have a little debt, and EPS growth was good last year. If it continues to grow, then the current low P/E may prove to be unjustified.
Investors have an opportunity when market expectations about a stock are wrong. If it is underestimating a company, investors can make money by buying and holding the shares until the market corrects itself. So this free report on the analyst consensus forecasts could help you make a master move on this stock.
Of course, you might find a fantastic investment by looking at a few good candidates. So take a peek at this free list of companies with modest (or no) debt, trading on a P/E below 20.
We aim to bring you long-term focused research analysis driven by fundamental data. Note that our analysis may not factor in the latest price-sensitive company announcements or qualitative material.
If you spot an error that warrants correction, please contact the editor at editorial-team@simplywallst.com. This article by Simply Wall St is general in nature. It does not constitute a recommendation to buy or sell any stock, and does not take account of your objectives, or your financial situation. Simply Wall St has no position in the stocks mentioned. Thank you for reading.
About ENXTPA:SK
SEB
Designs, manufactures, and markets small domestic equipment in Western Europe, rest of Europe, the Middle East, Africa, North and South America, China, and rest of Asia.
Moderate risk with adequate balance sheet.
Similar Companies
Market Insights

Advertisement
Community Narratives
The "Molecular Pencil": Why Beam's Technology is Built to Win
Fair Value US$65.01|65.4% undervalued
DA
Community Contributor
The silent giant behind virtually every advanced chip powering AI, smartphones, and modern infrastructure.
Fair Value US$310.00|6.1% undervalued
OS
Community Contributor
ADP Stock: Solid Fundamentals, But AI Investments Test Its Margin Resilience
Fair Value US$387.77|34.2% undervalued
YI
Community Contributor
MINISO's fair value is projected at 26.69 with an anticipated PE ratio shift of 20x
Fair Value US$24.03|9.6% undervalued
BE
Community Contributor