

Howard Marks put it nicely when he said that, rather than worrying about share price volatility, 'The possibility of permanent loss is the risk I worry about... and every practical investor I know worries about.' So it might be obvious that you need to consider debt, when you think about how risky any given stock is, because too much debt can sink a company. Importantly, SEB SA (EPA:SK) does carry debt. But is this debt a concern to shareholders?
When Is Debt A Problem?
Debt is a tool to help businesses grow, but if a business is incapable of paying off its lenders, then it exists at their mercy. Part and parcel of capitalism is the process of 'creative destruction' where failed businesses are mercilessly liquidated by their bankers. While that is not too common, we often do see indebted companies permanently diluting shareholders because lenders force them to raise capital at a distressed price. Of course, debt can be an important tool in businesses, particularly capital heavy businesses. When we examine debt levels, we first consider both cash and debt levels, together.
View our latest analysis for SEB
What Is SEB's Debt?
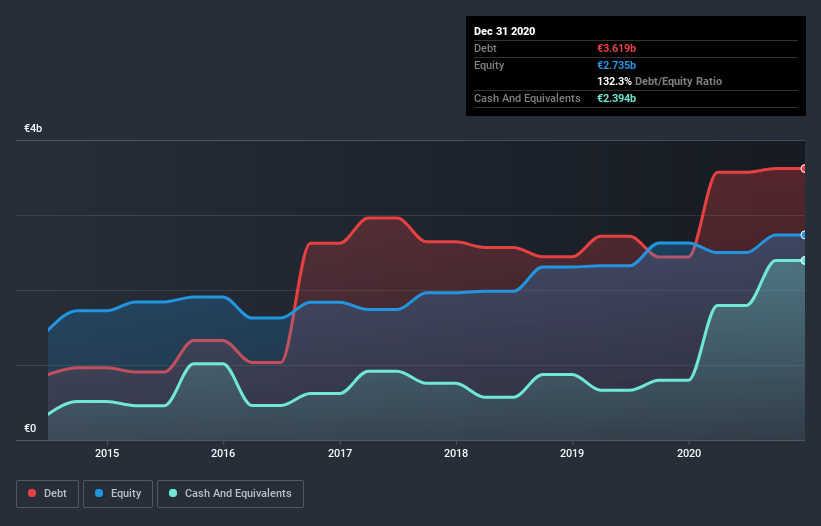
The image below, which you can click on for greater detail, shows that at December 2020 SEB had debt of €3.62b, up from €2.44b in one year. However, because it has a cash reserve of €2.39b, its net debt is less, at about €1.23b.
How Healthy Is SEB's Balance Sheet?
We can see from the most recent balance sheet that SEB had liabilities of €3.64b falling due within a year, and liabilities of €2.90b due beyond that. On the other hand, it had cash of €2.39b and €1.10b worth of receivables due within a year. So it has liabilities totalling €3.04b more than its cash and near-term receivables, combined.
While this might seem like a lot, it is not so bad since SEB has a market capitalization of €7.85b, and so it could probably strengthen its balance sheet by raising capital if it needed to. But it's clear that we should definitely closely examine whether it can manage its debt without dilution.
We measure a company's debt load relative to its earnings power by looking at its net debt divided by its earnings before interest, tax, depreciation, and amortization (EBITDA) and by calculating how easily its earnings before interest and tax (EBIT) cover its interest expense (interest cover). Thus we consider debt relative to earnings both with and without depreciation and amortization expenses.
SEB's net debt to EBITDA ratio of about 1.6 suggests only moderate use of debt. And its commanding EBIT of 28.0 times its interest expense, implies the debt load is as light as a peacock feather. But the bad news is that SEB has seen its EBIT plunge 17% in the last twelve months. If that rate of decline in earnings continues, the company could find itself in a tight spot. When analysing debt levels, the balance sheet is the obvious place to start. But it is future earnings, more than anything, that will determine SEB's ability to maintain a healthy balance sheet going forward. So if you want to see what the professionals think, you might find this free report on analyst profit forecasts to be interesting.
But our final consideration is also important, because a company cannot pay debt with paper profits; it needs cold hard cash. So we always check how much of that EBIT is translated into free cash flow. During the last three years, SEB generated free cash flow amounting to a very robust 92% of its EBIT, more than we'd expect. That positions it well to pay down debt if desirable to do so.
Our View
Both SEB's ability to to cover its interest expense with its EBIT and its conversion of EBIT to free cash flow gave us comfort that it can handle its debt. But truth be told its EBIT growth rate had us nibbling our nails. Considering this range of data points, we think SEB is in a good position to manage its debt levels. Having said that, the load is sufficiently heavy that we would recommend any shareholders keep a close eye on it. When analysing debt levels, the balance sheet is the obvious place to start. However, not all investment risk resides within the balance sheet - far from it. For instance, we've identified 2 warning signs for SEB that you should be aware of.
At the end of the day, it's often better to focus on companies that are free from net debt. You can access our special list of such companies (all with a track record of profit growth). It's free.
If you decide to trade SEB, use the lowest-cost* platform that is rated #1 Overall by Barron’s, Interactive Brokers. Trade stocks, options, futures, forex, bonds and funds on 135 markets, all from a single integrated account. Promoted
New: Manage All Your Stock Portfolios in One Place
We've created the ultimate portfolio companion for stock investors, and it's free.
• Connect an unlimited number of Portfolios and see your total in one currency
• Be alerted to new Warning Signs or Risks via email or mobile
• Track the Fair Value of your stocks
This article by Simply Wall St is general in nature. It does not constitute a recommendation to buy or sell any stock, and does not take account of your objectives, or your financial situation. We aim to bring you long-term focused analysis driven by fundamental data. Note that our analysis may not factor in the latest price-sensitive company announcements or qualitative material. Simply Wall St has no position in any stocks mentioned.
*Interactive Brokers Rated Lowest Cost Broker by StockBrokers.com Annual Online Review 2020
Have feedback on this article? Concerned about the content? Get in touch with us directly. Alternatively, email editorial-team (at) simplywallst.com.
About ENXTPA:SK
SEB
Designs, manufactures, and markets small domestic equipment in Western Europe, rest of Europe, the Middle East, Africa, North and South America, China, and rest of Asia.
Good value with adequate balance sheet and pays a dividend.
Similar Companies
Market Insights

Community Narratives

