

Some say volatility, rather than debt, is the best way to think about risk as an investor, but Warren Buffett famously said that 'Volatility is far from synonymous with risk.' When we think about how risky a company is, we always like to look at its use of debt, since debt overload can lead to ruin. As with many other companies Kering SA (EPA:KER) makes use of debt. But the more important question is: how much risk is that debt creating?
When Is Debt Dangerous?
Debt and other liabilities become risky for a business when it cannot easily fulfill those obligations, either with free cash flow or by raising capital at an attractive price. In the worst case scenario, a company can go bankrupt if it cannot pay its creditors. While that is not too common, we often do see indebted companies permanently diluting shareholders because lenders force them to raise capital at a distressed price. Of course, the upside of debt is that it often represents cheap capital, especially when it replaces dilution in a company with the ability to reinvest at high rates of return. The first thing to do when considering how much debt a business uses is to look at its cash and debt together.
See our latest analysis for Kering
How Much Debt Does Kering Carry?
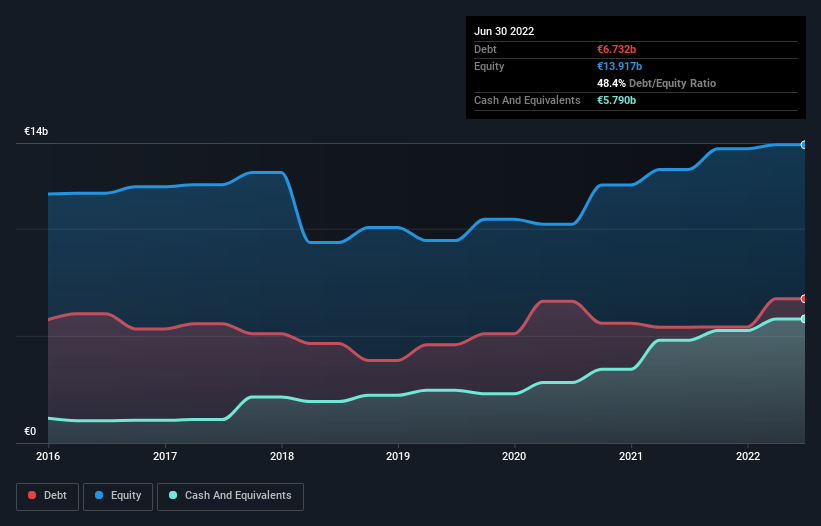
As you can see below, at the end of June 2022, Kering had €6.73b of debt, up from €5.41b a year ago. Click the image for more detail. However, it also had €5.79b in cash, and so its net debt is €942.0m.
How Healthy Is Kering's Balance Sheet?
We can see from the most recent balance sheet that Kering had liabilities of €9.24b falling due within a year, and liabilities of €10.0b due beyond that. Offsetting these obligations, it had cash of €5.79b as well as receivables valued at €2.01b due within 12 months. So its liabilities outweigh the sum of its cash and (near-term) receivables by €11.5b.
Kering has a very large market capitalization of €54.5b, so it could very likely raise cash to ameliorate its balance sheet, if the need arose. But we definitely want to keep our eyes open to indications that its debt is bringing too much risk.
In order to size up a company's debt relative to its earnings, we calculate its net debt divided by its earnings before interest, tax, depreciation, and amortization (EBITDA) and its earnings before interest and tax (EBIT) divided by its interest expense (its interest cover). This way, we consider both the absolute quantum of the debt, as well as the interest rates paid on it.
Kering has a low net debt to EBITDA ratio of only 0.15. And its EBIT covers its interest expense a whopping 40.5 times over. So we're pretty relaxed about its super-conservative use of debt. Also positive, Kering grew its EBIT by 27% in the last year, and that should make it easier to pay down debt, going forward. There's no doubt that we learn most about debt from the balance sheet. But it is future earnings, more than anything, that will determine Kering's ability to maintain a healthy balance sheet going forward. So if you want to see what the professionals think, you might find this free report on analyst profit forecasts to be interesting.
Finally, while the tax-man may adore accounting profits, lenders only accept cold hard cash. So the logical step is to look at the proportion of that EBIT that is matched by actual free cash flow. During the last three years, Kering produced sturdy free cash flow equating to 61% of its EBIT, about what we'd expect. This cold hard cash means it can reduce its debt when it wants to.
Our View
Happily, Kering's impressive interest cover implies it has the upper hand on its debt. And that's just the beginning of the good news since its net debt to EBITDA is also very heartening. Zooming out, Kering seems to use debt quite reasonably; and that gets the nod from us. While debt does bring risk, when used wisely it can also bring a higher return on equity. The balance sheet is clearly the area to focus on when you are analysing debt. However, not all investment risk resides within the balance sheet - far from it. Case in point: We've spotted 1 warning sign for Kering you should be aware of.
Of course, if you're the type of investor who prefers buying stocks without the burden of debt, then don't hesitate to discover our exclusive list of net cash growth stocks, today.
Valuation is complex, but we're here to simplify it.
Discover if Kering might be undervalued or overvalued with our detailed analysis, featuring fair value estimates, potential risks, dividends, insider trades, and its financial condition.
Access Free AnalysisHave feedback on this article? Concerned about the content? Get in touch with us directly. Alternatively, email editorial-team (at) simplywallst.com.
This article by Simply Wall St is general in nature. We provide commentary based on historical data and analyst forecasts only using an unbiased methodology and our articles are not intended to be financial advice. It does not constitute a recommendation to buy or sell any stock, and does not take account of your objectives, or your financial situation. We aim to bring you long-term focused analysis driven by fundamental data. Note that our analysis may not factor in the latest price-sensitive company announcements or qualitative material. Simply Wall St has no position in any stocks mentioned.
About ENXTPA:KER
Kering
Manages the development of a collection of renowned houses in fashion, leather goods, and jewelry in the Asia Pacific, Western Europe, North America, Japan, and internationally.
Average dividend payer and fair value.
Market Insights

Community Narratives

