
Advertisement

Warren Buffett famously said, 'Volatility is far from synonymous with risk.' So it might be obvious that you need to consider debt, when you think about how risky any given stock is, because too much debt can sink a company. Importantly, Synergie SE (EPA:SDG) does carry debt. But the more important question is: how much risk is that debt creating?
When Is Debt A Problem?
Debt is a tool to help businesses grow, but if a business is incapable of paying off its lenders, then it exists at their mercy. If things get really bad, the lenders can take control of the business. However, a more frequent (but still costly) occurrence is where a company must issue shares at bargain-basement prices, permanently diluting shareholders, just to shore up its balance sheet. By replacing dilution, though, debt can be an extremely good tool for businesses that need capital to invest in growth at high rates of return. When we examine debt levels, we first consider both cash and debt levels, together.
View our latest analysis for Synergie
What Is Synergie's Debt?
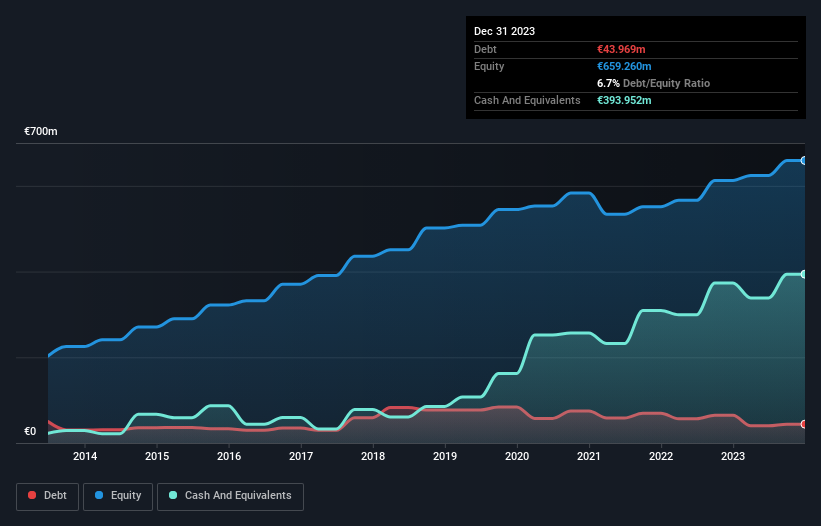
The image below, which you can click on for greater detail, shows that Synergie had debt of €44.0m at the end of December 2023, a reduction from €64.6m over a year. But it also has €394.0m in cash to offset that, meaning it has €350.0m net cash.
A Look At Synergie's Liabilities
We can see from the most recent balance sheet that Synergie had liabilities of €706.4m falling due within a year, and liabilities of €85.3m due beyond that. Offsetting these obligations, it had cash of €394.0m as well as receivables valued at €741.6m due within 12 months. So it can boast €343.9m more liquid assets than total liabilities.
This excess liquidity is a great indication that Synergie's balance sheet is almost as strong as Fort Knox. Having regard to this fact, we think its balance sheet is as strong as an ox. Succinctly put, Synergie boasts net cash, so it's fair to say it does not have a heavy debt load!
On the other hand, Synergie's EBIT dived 12%, over the last year. If that rate of decline in earnings continues, the company could find itself in a tight spot. There's no doubt that we learn most about debt from the balance sheet. But it is future earnings, more than anything, that will determine Synergie's ability to maintain a healthy balance sheet going forward. So if you're focused on the future you can check out this free report showing analyst profit forecasts.
But our final consideration is also important, because a company cannot pay debt with paper profits; it needs cold hard cash. While Synergie has net cash on its balance sheet, it's still worth taking a look at its ability to convert earnings before interest and tax (EBIT) to free cash flow, to help us understand how quickly it is building (or eroding) that cash balance. Over the last three years, Synergie recorded free cash flow worth a fulsome 97% of its EBIT, which is stronger than we'd usually expect. That puts it in a very strong position to pay down debt.
Summing Up
While it is always sensible to investigate a company's debt, in this case Synergie has €350.0m in net cash and a decent-looking balance sheet. The cherry on top was that in converted 97% of that EBIT to free cash flow, bringing in €92m. So is Synergie's debt a risk? It doesn't seem so to us. There's no doubt that we learn most about debt from the balance sheet. However, not all investment risk resides within the balance sheet - far from it. These risks can be hard to spot. Every company has them, and we've spotted 1 warning sign for Synergie you should know about.
When all is said and done, sometimes its easier to focus on companies that don't even need debt. Readers can access a list of growth stocks with zero net debt 100% free, right now.
New: Manage All Your Stock Portfolios in One Place
We've created the ultimate portfolio companion for stock investors, and it's free.
• Connect an unlimited number of Portfolios and see your total in one currency
• Be alerted to new Warning Signs or Risks via email or mobile
• Track the Fair Value of your stocks
Have feedback on this article? Concerned about the content? Get in touch with us directly. Alternatively, email editorial-team (at) simplywallst.com.
This article by Simply Wall St is general in nature. We provide commentary based on historical data and analyst forecasts only using an unbiased methodology and our articles are not intended to be financial advice. It does not constitute a recommendation to buy or sell any stock, and does not take account of your objectives, or your financial situation. We aim to bring you long-term focused analysis driven by fundamental data. Note that our analysis may not factor in the latest price-sensitive company announcements or qualitative material. Simply Wall St has no position in any stocks mentioned.
About ENXTPA:SDG
Synergie
Provides human resources management and development services for companies and institutions in France, Belgium, Other Northern and Eastern Europe, Italy, Spain, Portugal, Canada, and Australia.
Flawless balance sheet and good value.
Similar Companies
Market Insights


Advertisement
Community Narratives
Alphabet: The Under-appreciated Compounder Hiding in Plain Sight
Fair Value US$282.83|30.2% undervalued
BL
Community Contributor
Planet Labs: At The Heart Of The Emerging New Space Boom
Fair Value US$11.31|44.5% undervalued
AN
Community Contributor
Exxon in Guyana 5 year forecast Low $135 to High $189
Fair Value US$189.00|40.8% undervalued
AG
Community Contributor