
Advertisement
- France
- /
- Electrical
- /
- ENXTPA:SU
Schneider Electric's (EPA:SU) five-year total shareholder returns outpace the underlying earnings growth
The most you can lose on any stock (assuming you don't use leverage) is 100% of your money. But on a lighter note, a good company can see its share price rise well over 100%. Long term Schneider Electric S.E. (EPA:SU) shareholders would be well aware of this, since the stock is up 129% in five years. On top of that, the share price is up 17% in about a quarter.
While the stock has fallen 3.5% this week, it's worth focusing on the longer term and seeing if the stocks historical returns have been driven by the underlying fundamentals.
There is no denying that markets are sometimes efficient, but prices do not always reflect underlying business performance. One way to examine how market sentiment has changed over time is to look at the interaction between a company's share price and its earnings per share (EPS).
Over half a decade, Schneider Electric managed to grow its earnings per share at 12% a year. This EPS growth is lower than the 18% average annual increase in the share price. So it's fair to assume the market has a higher opinion of the business than it did five years ago. That's not necessarily surprising considering the five-year track record of earnings growth.
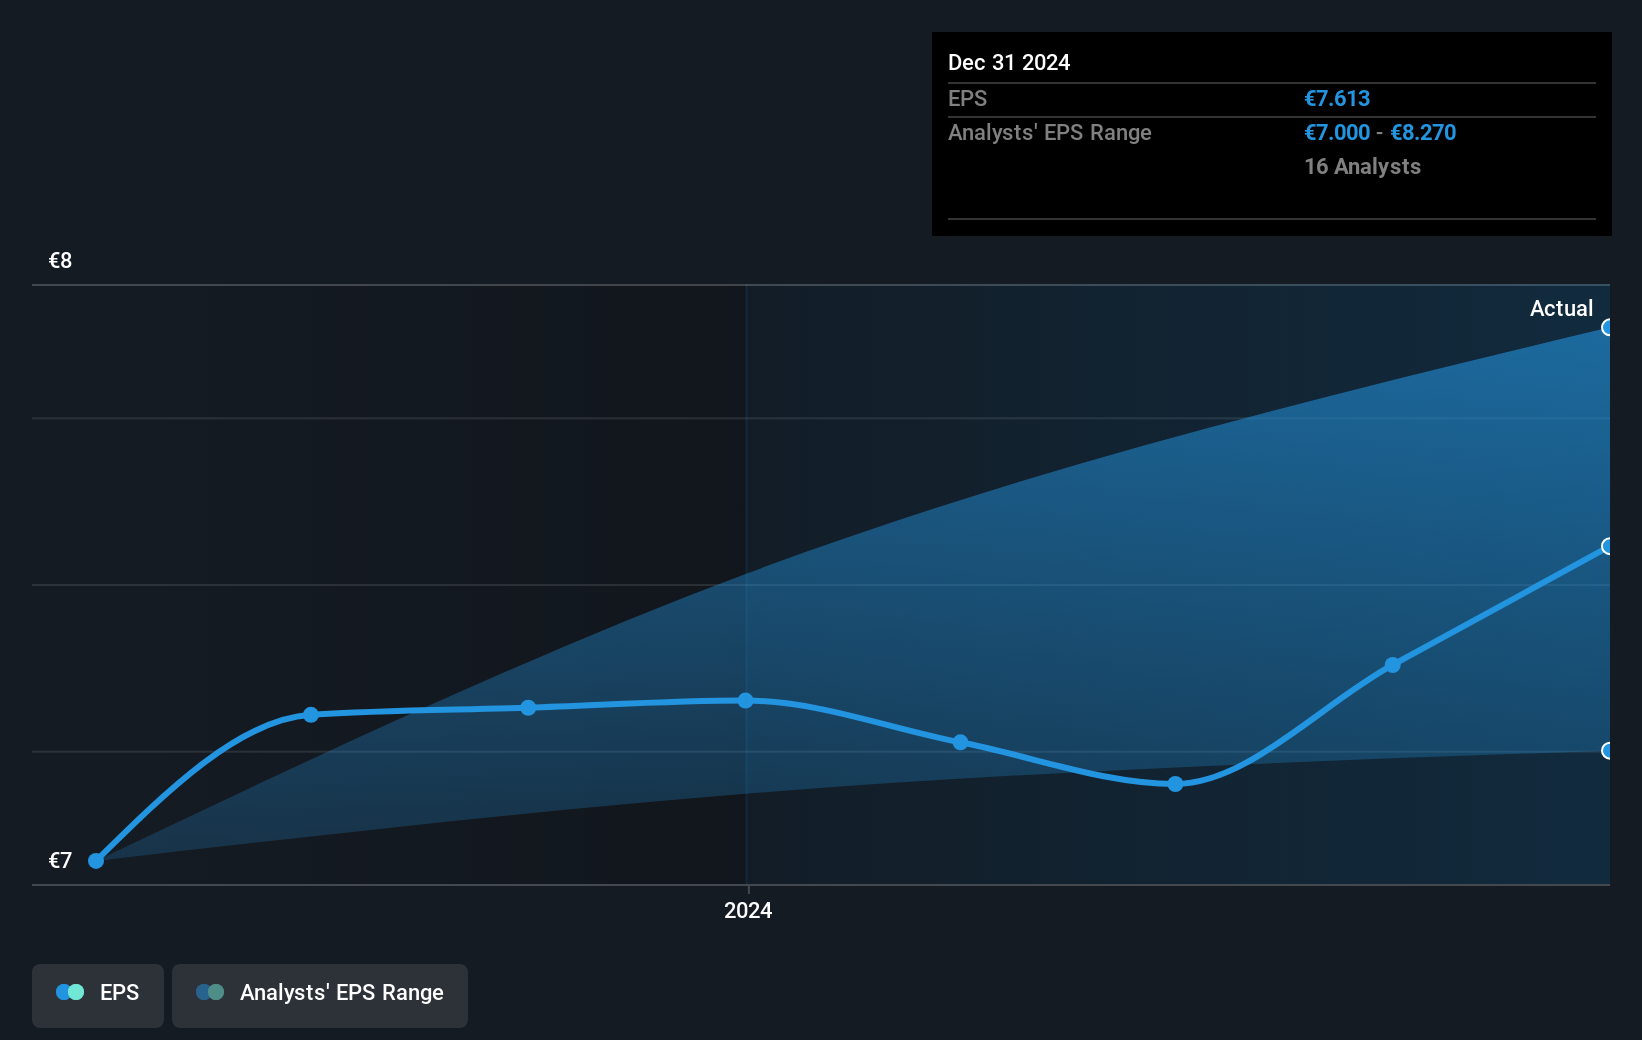
The company's earnings per share (over time) is depicted in the image below (click to see the exact numbers).
We're pleased to report that the CEO is remunerated more modestly than most CEOs at similarly capitalized companies. It's always worth keeping an eye on CEO pay, but a more important question is whether the company will grow earnings throughout the years. Before buying or selling a stock, we always recommend a close examination of historic growth trends, available here..
What About Dividends?
It is important to consider the total shareholder return, as well as the share price return, for any given stock. The TSR is a return calculation that accounts for the value of cash dividends (assuming that any dividend received was reinvested) and the calculated value of any discounted capital raisings and spin-offs. Arguably, the TSR gives a more comprehensive picture of the return generated by a stock. We note that for Schneider Electric the TSR over the last 5 years was 152%, which is better than the share price return mentioned above. This is largely a result of its dividend payments!
A Different Perspective
Investors in Schneider Electric had a tough year, with a total loss of 0.8% (including dividends), against a market gain of about 2.7%. Even the share prices of good stocks drop sometimes, but we want to see improvements in the fundamental metrics of a business, before getting too interested. On the bright side, long term shareholders have made money, with a gain of 20% per year over half a decade. If the fundamental data continues to indicate long term sustainable growth, the current sell-off could be an opportunity worth considering. Before forming an opinion on Schneider Electric you might want to consider these 3 valuation metrics.
If you like to buy stocks alongside management, then you might just love this free list of companies. (Hint: many of them are unnoticed AND have attractive valuation).
Please note, the market returns quoted in this article reflect the market weighted average returns of stocks that currently trade on French exchanges.
New: Manage All Your Stock Portfolios in One Place
We've created the ultimate portfolio companion for stock investors, and it's free.
• Connect an unlimited number of Portfolios and see your total in one currency
• Be alerted to new Warning Signs or Risks via email or mobile
• Track the Fair Value of your stocks
Have feedback on this article? Concerned about the content? Get in touch with us directly. Alternatively, email editorial-team (at) simplywallst.com.
This article by Simply Wall St is general in nature. We provide commentary based on historical data and analyst forecasts only using an unbiased methodology and our articles are not intended to be financial advice. It does not constitute a recommendation to buy or sell any stock, and does not take account of your objectives, or your financial situation. We aim to bring you long-term focused analysis driven by fundamental data. Note that our analysis may not factor in the latest price-sensitive company announcements or qualitative material. Simply Wall St has no position in any stocks mentioned.
About ENXTPA:SU
Schneider Electric
Engages in the energy management and industrial automation businesses worldwide.
Proven track record with adequate balance sheet and pays a dividend.
Similar Companies
Market Insights

Advertisement
Community Narratives
MINISO's fair value is projected at 26.69 with an anticipated PE ratio shift of 20x
Fair Value US$24.03|11.0% undervalued
BE
Community Contributor
Procter & Gamble: A Dividend Giant Facing Slowing Growth
Fair Value US$119.81|23.3% overvalued
AN
Community Contributor
Eli Lilly's Future Growth Driven by Tirzepatide and Favorable Market Conditions
Fair Value US$1.19k|13.8% undervalued
EA
Community Contributor