Advertisement
- France
- /
- Electrical
- /
- ENXTPA:SU
Does Schneider Electric’s Price Reflect Potential After Recent AI Partnership Announcement?

Simply Wall St
Reviewed by Bailey Pemberton
If you’re wondering what to do with Schneider Electric stock these days, you’re definitely not alone. With a closing price of €246.1 and strong long-term returns, plenty of investors are revisiting whether this industrial giant could power up their portfolios. Over the past month, Schneider Electric’s shares have climbed a sturdy 8.4%, following a solid three-year gain of 106.8% and an impressive 145.6% surge over five years. In other words, there have been major tailwinds driving this stock. With global shifts toward automation and energy efficiency, the optimism is understandable.
Admittedly, the year-to-date and recent one-year gains have been much more modest, hovering just below 2%. Some of that tempered performance reflects a brief cooling off after a multi-year rally, and perhaps a change in how the market perceives risk in the sector. Even with this pause, the broader sentiment remains upbeat, encouraged by ongoing innovation and regulatory support for energy management solutions.
Here's where things get interesting: despite all this positive momentum, Schneider Electric only scores a 1 out of 6 on our undervaluation checklist. That means the company is undervalued on just one key measure, a signal that warrants a closer look. Next, we’ll break down exactly how Schneider Electric’s valuation stacks up across multiple methods. Later, we’ll explore an even more insightful way to judge if the stock deserves a spot in your portfolio.
Schneider Electric scores just 1/6 on our valuation checks. See what other red flags we found in the full valuation breakdown.
Approach 1: Schneider Electric Discounted Cash Flow (DCF) Analysis
The Discounted Cash Flow (DCF) model estimates what a company is really worth by projecting its expected future cash flows and then discounting those numbers back to today. In simple terms, it is a way to put a present-day value on Schneider Electric based on the cash it is expected to generate over time.
Currently, Schneider Electric reports a last twelve months Free Cash Flow (FCF) of €3.79 billion. Analyst forecasts suggest FCF will continue to grow, with projections reaching €5.84 billion by 2029. After that, extrapolated growth suggests incremental increases out to 2035. It is worth noting that analyst estimates are stronger for the next five years, while anything beyond that relies on long-term assumptions rather than hard forecasts.
Running these figures through the DCF model returns an intrinsic value of €142.49 per share, which is significantly lower than the current market price of €246.10. This translates to a calculated intrinsic discount of approximately 72.7%, meaning the stock appears heavily overvalued according to this methodology.
Result: OVERVALUED
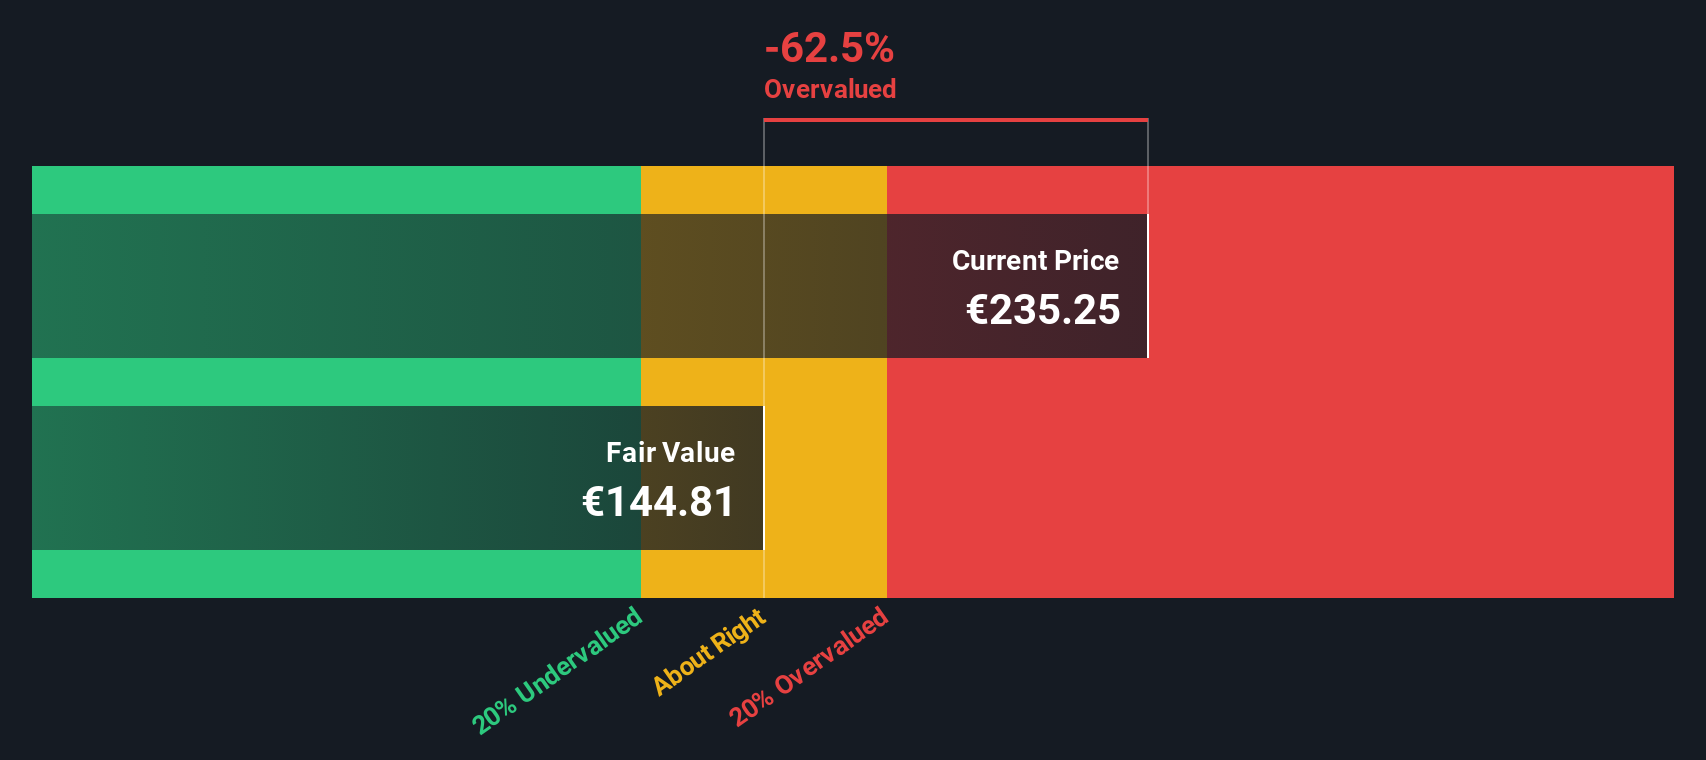
Our Discounted Cash Flow (DCF) analysis suggests Schneider Electric may be overvalued by 72.7%. Find undervalued stocks or create your own screener to find better value opportunities.
Approach 2: Schneider Electric Price vs Earnings
The Price-to-Earnings (PE) ratio is the preferred valuation metric for Schneider Electric because it is a profitable business with stable earnings. The PE ratio is a widely used measure that tells investors how much they are paying for each euro of earnings, making it a helpful tool for comparing companies in the same industry, especially those with strong profit generation.
However, it is important to recognize that what is considered a “fair” PE ratio can vary based on several factors. Higher anticipated growth rates or lower perceived risk can justify higher PE ratios, while stagnant earnings or sector uncertainty generally support lower values. This means that context, such as future growth outlook and company stability, matters a lot when interpreting a company’s PE.
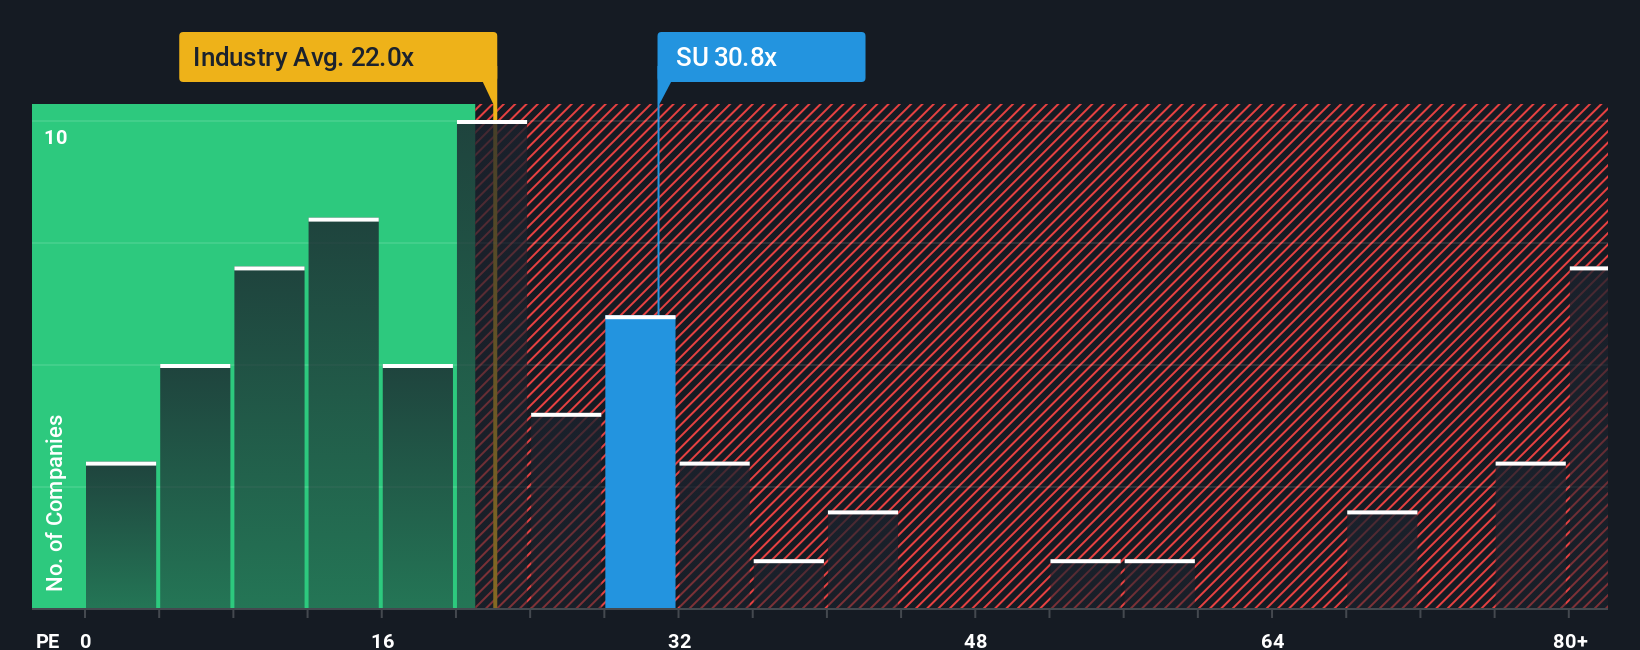
Currently, Schneider Electric trades at a PE ratio of 32.2x. For comparison, the average for its industry stands at 31.9x, while similar peers average 25.7x. While these figures suggest Schneider Electric is toward the upper end of the range, Simply Wall St’s proprietary Fair Ratio for the company is 34.3x. This Fair Ratio is more informative than industry or peer benchmarks because it factors in the company’s specific growth prospects, risk profile, profit margins, market capitalization, and its sector. It essentially shows what a “normal” PE should be, given Schneider Electric’s unique situation.
Since the current PE ratio is just below the Fair Ratio, Schneider Electric’s valuation appears to be about right at present levels.
Result: ABOUT RIGHT
PE ratios tell one story, but what if the real opportunity lies elsewhere? Discover companies where insiders are betting big on explosive growth.
Upgrade Your Decision Making: Choose your Schneider Electric Narrative
Earlier we mentioned that there is an even better way to understand valuation, so let's introduce you to Narratives. Simply put, a Narrative is your personal story behind the numbers: it is a framework where you connect your view of a company’s future (estimates for revenue, earnings, and margins) to a financial forecast and from there to a fair value.
Instead of just relying on a single metric or analyst estimate, Narratives let you dig deeper, quantify your beliefs, and clearly see what would make Schneider Electric a buy or a sell for you. On the Simply Wall St Community page, millions of investors use Narratives as an intuitive, accessible tool to bring their investing logic to life. When news or earnings come in, Narratives automatically update so your conclusions are always fresh.
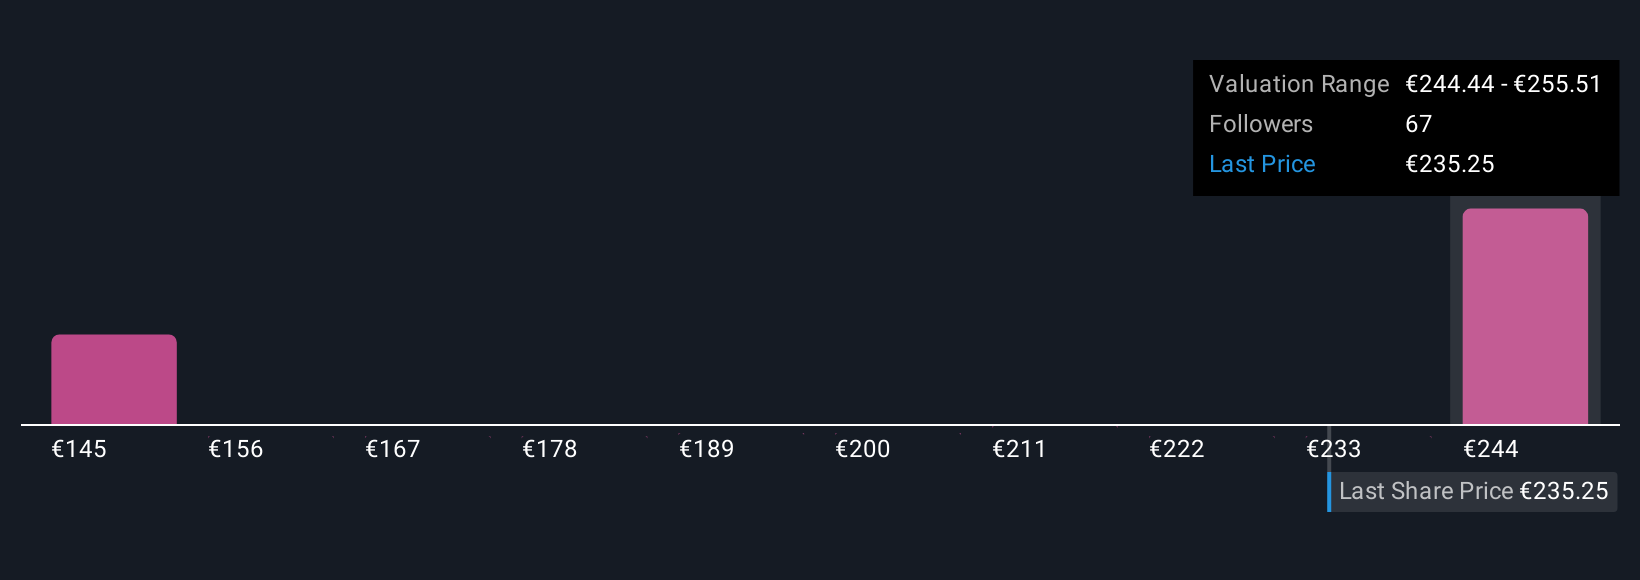
For instance, among recent Schneider Electric Narratives, one optimistic perspective expects profit margins to rise above 13%, supporting a fair value over €289 per share, while a more cautious view expects slower growth and sees fair value closer to €220. This means you can easily compare stories, assumptions, and price targets and decide what you believe, so your investments reflect your own convictions, not just consensus opinion.
Do you think there's more to the story for Schneider Electric? Create your own Narrative to let the Community know!
This article by Simply Wall St is general in nature. We provide commentary based on historical data and analyst forecasts only using an unbiased methodology and our articles are not intended to be financial advice. It does not constitute a recommendation to buy or sell any stock, and does not take account of your objectives, or your financial situation. We aim to bring you long-term focused analysis driven by fundamental data. Note that our analysis may not factor in the latest price-sensitive company announcements or qualitative material. Simply Wall St has no position in any stocks mentioned.
New: Manage All Your Stock Portfolios in One Place
We've created the ultimate portfolio companion for stock investors, and it's free.
• Connect an unlimited number of Portfolios and see your total in one currency
• Be alerted to new Warning Signs or Risks via email or mobile
• Track the Fair Value of your stocks
Have feedback on this article? Concerned about the content? Get in touch with us directly. Alternatively, email editorial-team@simplywallst.com
About ENXTPA:SU
Schneider Electric
Engages in the energy management and industrial automation businesses worldwide.
Proven track record with adequate balance sheet and pays a dividend.
Similar Companies
Market Insights

Advertisement
Community Narratives
Kodiak AI - a potential 100 bagger opportunity?
Fair Value US$14.00|44.7% undervalued
DA
Community Contributor
A Fair Price for a Great Business Facing Real Threats
Fair Value US$383.06|13.0% undervalued
IM
Community Contributor
AXON And Shopify Integration Will Unlock Global Mobile Advertising
Fair Value US$613.59|2.3% undervalued
AN
Based on Analyst Price Targets