- France
- /
- Electrical
- /
- ENXTPA:NEX
These 4 Measures Indicate That Nexans (EPA:NEX) Is Using Debt Reasonably Well


David Iben put it well when he said, 'Volatility is not a risk we care about. What we care about is avoiding the permanent loss of capital.' When we think about how risky a company is, we always like to look at its use of debt, since debt overload can lead to ruin. We note that Nexans S.A. (EPA:NEX) does have debt on its balance sheet. But should shareholders be worried about its use of debt?
What Risk Does Debt Bring?
Debt is a tool to help businesses grow, but if a business is incapable of paying off its lenders, then it exists at their mercy. Ultimately, if the company can't fulfill its legal obligations to repay debt, shareholders could walk away with nothing. However, a more frequent (but still costly) occurrence is where a company must issue shares at bargain-basement prices, permanently diluting shareholders, just to shore up its balance sheet. By replacing dilution, though, debt can be an extremely good tool for businesses that need capital to invest in growth at high rates of return. The first thing to do when considering how much debt a business uses is to look at its cash and debt together.
See our latest analysis for Nexans
What Is Nexans's Net Debt?
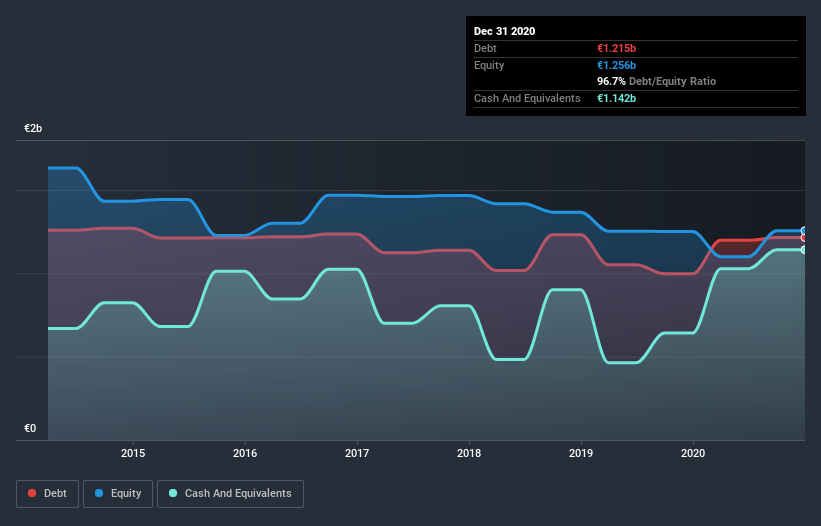
You can click the graphic below for the historical numbers, but it shows that as of December 2020 Nexans had €1.22b of debt, an increase on €997.0m, over one year. However, because it has a cash reserve of €1.14b, its net debt is less, at about €73.0m.
How Strong Is Nexans' Balance Sheet?
The latest balance sheet data shows that Nexans had liabilities of €2.73b due within a year, and liabilities of €1.25b falling due after that. Offsetting this, it had €1.14b in cash and €1.08b in receivables that were due within 12 months. So it has liabilities totalling €1.75b more than its cash and near-term receivables, combined.
This deficit is considerable relative to its market capitalization of €2.83b, so it does suggest shareholders should keep an eye on Nexans' use of debt. Should its lenders demand that it shore up the balance sheet, shareholders would likely face severe dilution.
We measure a company's debt load relative to its earnings power by looking at its net debt divided by its earnings before interest, tax, depreciation, and amortization (EBITDA) and by calculating how easily its earnings before interest and tax (EBIT) cover its interest expense (interest cover). The advantage of this approach is that we take into account both the absolute quantum of debt (with net debt to EBITDA) and the actual interest expenses associated with that debt (with its interest cover ratio).
While Nexans's low debt to EBITDA ratio of 0.21 suggests only modest use of debt, the fact that EBIT only covered the interest expense by 6.0 times last year does give us pause. So we'd recommend keeping a close eye on the impact financing costs are having on the business. Importantly Nexans's EBIT was essentially flat over the last twelve months. Ideally it can diminish its debt load by kick-starting earnings growth. When analysing debt levels, the balance sheet is the obvious place to start. But it is future earnings, more than anything, that will determine Nexans's ability to maintain a healthy balance sheet going forward. So if you want to see what the professionals think, you might find this free report on analyst profit forecasts to be interesting.
Finally, while the tax-man may adore accounting profits, lenders only accept cold hard cash. So it's worth checking how much of that EBIT is backed by free cash flow. Over the most recent three years, Nexans recorded free cash flow worth 55% of its EBIT, which is around normal, given free cash flow excludes interest and tax. This cold hard cash means it can reduce its debt when it wants to.
Our View
On our analysis Nexans's net debt to EBITDA should signal that it won't have too much trouble with its debt. But the other factors we noted above weren't so encouraging. For example, its level of total liabilities makes us a little nervous about its debt. Looking at all this data makes us feel a little cautious about Nexans's debt levels. While debt does have its upside in higher potential returns, we think shareholders should definitely consider how debt levels might make the stock more risky. When analysing debt levels, the balance sheet is the obvious place to start. However, not all investment risk resides within the balance sheet - far from it. For example, we've discovered 1 warning sign for Nexans that you should be aware of before investing here.
At the end of the day, it's often better to focus on companies that are free from net debt. You can access our special list of such companies (all with a track record of profit growth). It's free.
If you’re looking to trade Nexans, open an account with the lowest-cost* platform trusted by professionals, Interactive Brokers. Their clients from over 200 countries and territories trade stocks, options, futures, forex, bonds and funds worldwide from a single integrated account. Promoted
If you're looking to trade Nexans, open an account with the lowest-cost platform trusted by professionals, Interactive Brokers.
With clients in over 200 countries and territories, and access to 160 markets, IBKR lets you trade stocks, options, futures, forex, bonds and funds from a single integrated account.
Enjoy no hidden fees, no account minimums, and FX conversion rates as low as 0.03%, far better than what most brokers offer.
Sponsored ContentValuation is complex, but we're here to simplify it.
Discover if Nexans might be undervalued or overvalued with our detailed analysis, featuring fair value estimates, potential risks, dividends, insider trades, and its financial condition.
Access Free AnalysisThis article by Simply Wall St is general in nature. It does not constitute a recommendation to buy or sell any stock, and does not take account of your objectives, or your financial situation. We aim to bring you long-term focused analysis driven by fundamental data. Note that our analysis may not factor in the latest price-sensitive company announcements or qualitative material. Simply Wall St has no position in any stocks mentioned.
*Interactive Brokers Rated Lowest Cost Broker by StockBrokers.com Annual Online Review 2020
Have feedback on this article? Concerned about the content? Get in touch with us directly. Alternatively, email editorial-team (at) simplywallst.com.
About ENXTPA:NEX
Nexans
Manufactures and sells cables in France, Canada, Norway, Germany, and internationally.
Excellent balance sheet and good value.
Similar Companies
Market Insights

Community Narratives

