Stock Analysis
- France
- /
- Electrical
- /
- ENXTPA:NEX
Nexans (EPA:NEX) shareholders have earned a 34% CAGR over the last five years


We think all investors should try to buy and hold high quality multi-year winners. While not every stock performs well, when investors win, they can win big. For example, the Nexans S.A. (EPA:NEX) share price is up a whopping 308% in the last half decade, a handsome return for long term holders. If that doesn't get you thinking about long term investing, we don't know what will. On top of that, the share price is up 17% in about a quarter.
So let's investigate and see if the longer term performance of the company has been in line with the underlying business' progress.
See our latest analysis for Nexans
While the efficient markets hypothesis continues to be taught by some, it has been proven that markets are over-reactive dynamic systems, and investors are not always rational. One flawed but reasonable way to assess how sentiment around a company has changed is to compare the earnings per share (EPS) with the share price.
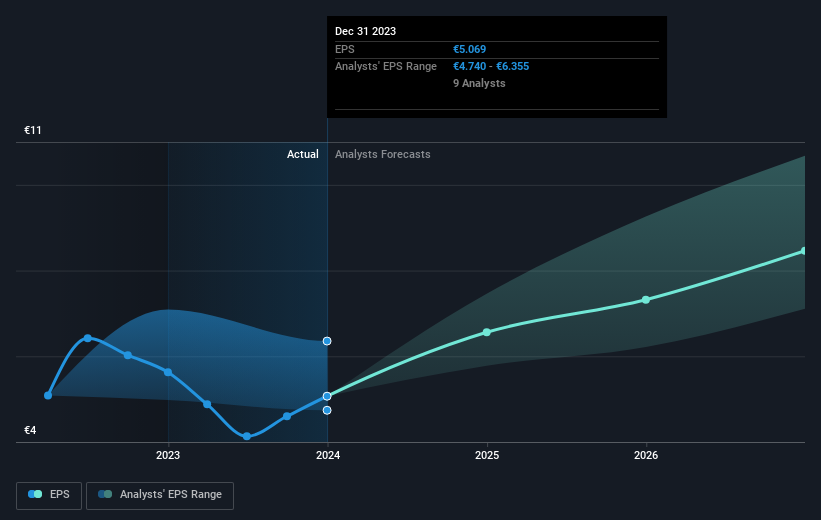
Over half a decade, Nexans managed to grow its earnings per share at 73% a year. The EPS growth is more impressive than the yearly share price gain of 32% over the same period. Therefore, it seems the market has become relatively pessimistic about the company.
The image below shows how EPS has tracked over time (if you click on the image you can see greater detail).
It is of course excellent to see how Nexans has grown profits over the years, but the future is more important for shareholders. You can see how its balance sheet has strengthened (or weakened) over time in this free interactive graphic.
What About Dividends?
It is important to consider the total shareholder return, as well as the share price return, for any given stock. The TSR is a return calculation that accounts for the value of cash dividends (assuming that any dividend received was reinvested) and the calculated value of any discounted capital raisings and spin-offs. So for companies that pay a generous dividend, the TSR is often a lot higher than the share price return. We note that for Nexans the TSR over the last 5 years was 339%, which is better than the share price return mentioned above. The dividends paid by the company have thusly boosted the total shareholder return.
A Different Perspective
It's good to see that Nexans has rewarded shareholders with a total shareholder return of 53% in the last twelve months. And that does include the dividend. That's better than the annualised return of 34% over half a decade, implying that the company is doing better recently. In the best case scenario, this may hint at some real business momentum, implying that now could be a great time to delve deeper. I find it very interesting to look at share price over the long term as a proxy for business performance. But to truly gain insight, we need to consider other information, too. Consider for instance, the ever-present spectre of investment risk. We've identified 1 warning sign with Nexans , and understanding them should be part of your investment process.
We will like Nexans better if we see some big insider buys. While we wait, check out this free list of undervalued stocks (mostly small caps) with considerable, recent, insider buying.
Please note, the market returns quoted in this article reflect the market weighted average returns of stocks that currently trade on French exchanges.
Valuation is complex, but we're helping make it simple.
Find out whether Nexans is potentially over or undervalued by checking out our comprehensive analysis, which includes fair value estimates, risks and warnings, dividends, insider transactions and financial health.
View the Free AnalysisHave feedback on this article? Concerned about the content? Get in touch with us directly. Alternatively, email editorial-team (at) simplywallst.com.
This article by Simply Wall St is general in nature. We provide commentary based on historical data and analyst forecasts only using an unbiased methodology and our articles are not intended to be financial advice. It does not constitute a recommendation to buy or sell any stock, and does not take account of your objectives, or your financial situation. We aim to bring you long-term focused analysis driven by fundamental data. Note that our analysis may not factor in the latest price-sensitive company announcements or qualitative material. Simply Wall St has no position in any stocks mentioned.
About ENXTPA:NEX
Nexans
Manufactures and sells cables in France, Canada, Norway, Germany, and internationally.
Flawless balance sheet second-rate dividend payer.
